CtG Plunges Below 2020, INR Record, No US Income
EDU DDA Jul. 31, 2025
Summary: Raw copper was taken off the tariff list resulting in an historic crash in copper prices. Removing that distortion revealed the real level of unspoiled copper to gold which also plunged, but to a new four-decade low surpassing March 2020 and 2008. That’s not all: India’s rupee plummeted to its own record low. Then the US BEA put out income data for the US economy which confirmed all these grim financial signals coming from all over the place. There are no cleanest dirty shirts, only increasing soiled ones. But what does that really mean?

TODAY’S MACRO DATA AND MARKET ACTION PROVES THERE ARE ONLY DIRTY ONES.
After being held up by more non-economics, copper finally crashed. This was hardly unexpected, practically everyone knew the reckoning was going to be violent, but this still has been something else. It has now produced a record fall in copper which pushed the copper-to-gold ratio down to a new low surpassing 2020, 2016 or any point in 2008-09.
Not to be outdone, India’s rupee set a record low of its own. Unbeknownst to most, these are indeed related results, neither unlike the desperate negatives we’ve been getting out of the swap market in US$s.
Why?
How’s this for more macro confirmation and coming out of the USA: real spending was off as real incomes excluding transfers declined yet again. The United States is supposed to be the cleanest dirty shirt, yet it is getting more not less difficult to even make that case.
For all this evidence pouring in from markets and economic accounts, many remain utterly convinced the US is in fantastic shape. After all, GDP hit 3% last quarter and who knows what we’ll get from the BLS and its payroll report tomorrow morning. The Federal Reserve is far more concerned about inflation.
Take a look at the income and spending data and tell me how in the world Jay Powell says the economy and labor market are solid with a straight face. It is as clear as day they are not.
Meanwhile, copper-to-gold is barely above 0.008% now that the artificiality propping up copper has predictably disappeared even if a totally unexpected way. We better hope that’s not how the same in the economy gets removed just up ahead, too.
As damning as yesterday was with second quarter GDP, the hits just keep on coming from all sides.
C to the G
Over the last fifteen months, we’ve seen copper spike now three separate times and each time having nothing to do with actual demand. That spoils the usefulness of the copper-to-gold ratio (CtG) since the numerator is supposed to be anchored in the real economy, not whatever supply restriction imposed by governmental policies somewhere (the first copper supply squeeze was China’s).
The past two of those supply shocks have been related to US tariffs. Fears over the Trump administration including raw copper on the list had sent copper suppliers scrambling. It got so bad, several ships laden with the metal have been speeding their way toward American ports racing to beat the deadline.
Only to have it called off! Yesterday, the Trump team decided they’d only sanction refined and finished copper products rather than the raw material. The unexpected abeyance provoked a massive wave of selling at the CME and elsewhere, sending the futures price down by a record, dumping more than 20% on the day.
It was an utter bloodbath.

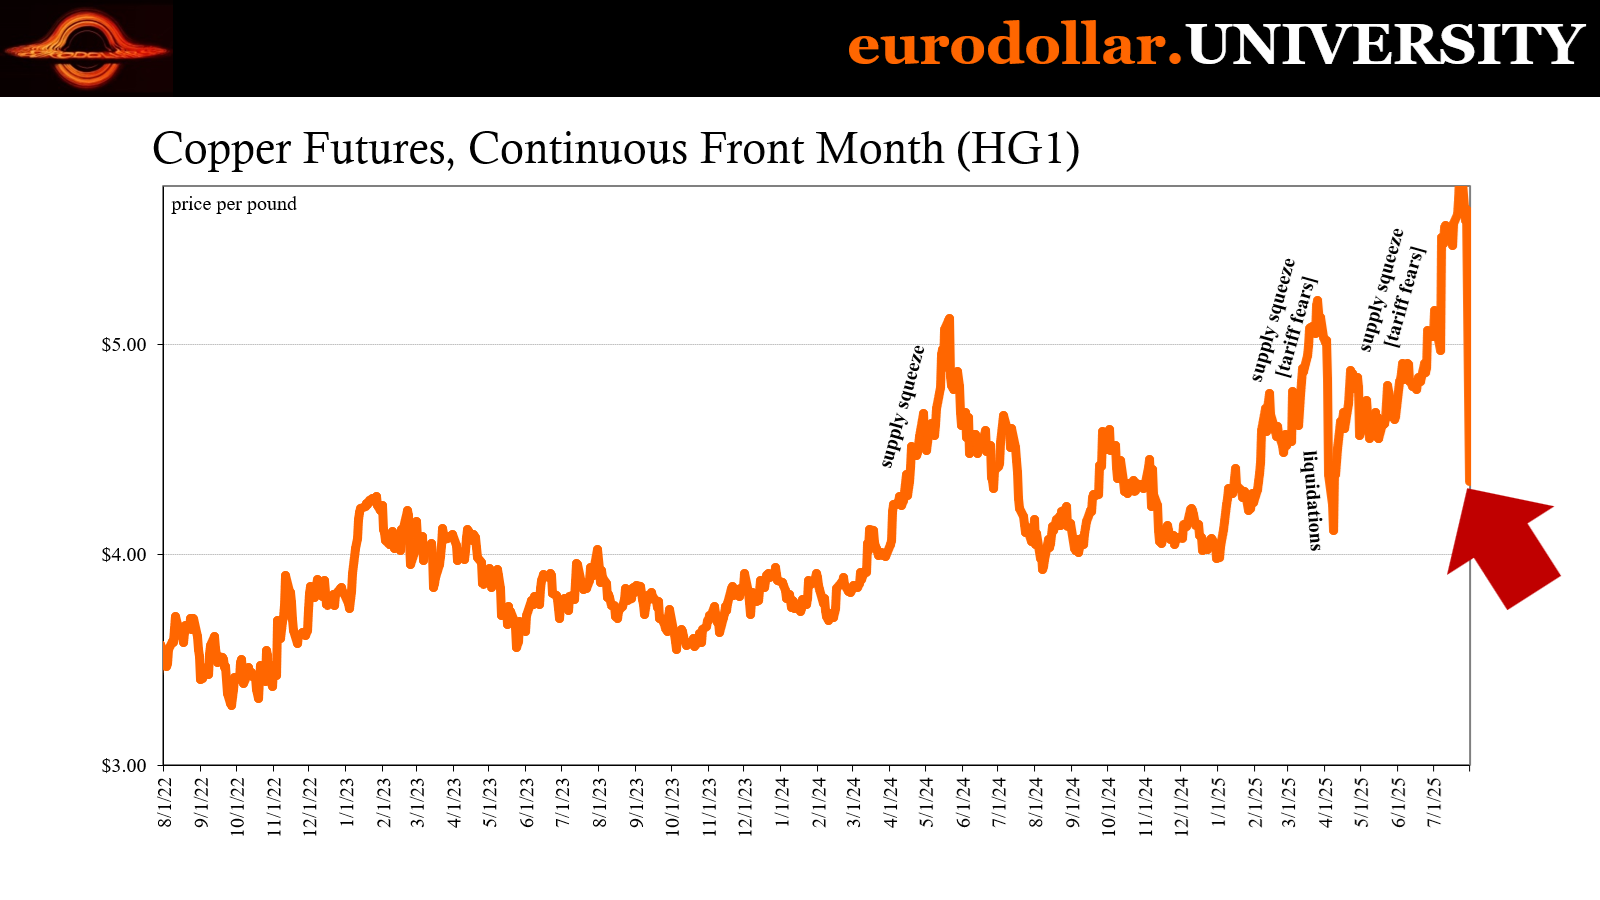
Again, the direction was hardly unexpected, the degree and all at once certainly was. Everyone knew there was a reversion coming, and that no sane macro perspective could possibly have Dr. Copper priced near $6 per pound. Zero fundamental justification for it. This also meant, when compared to gold, we had a spoiled signal.
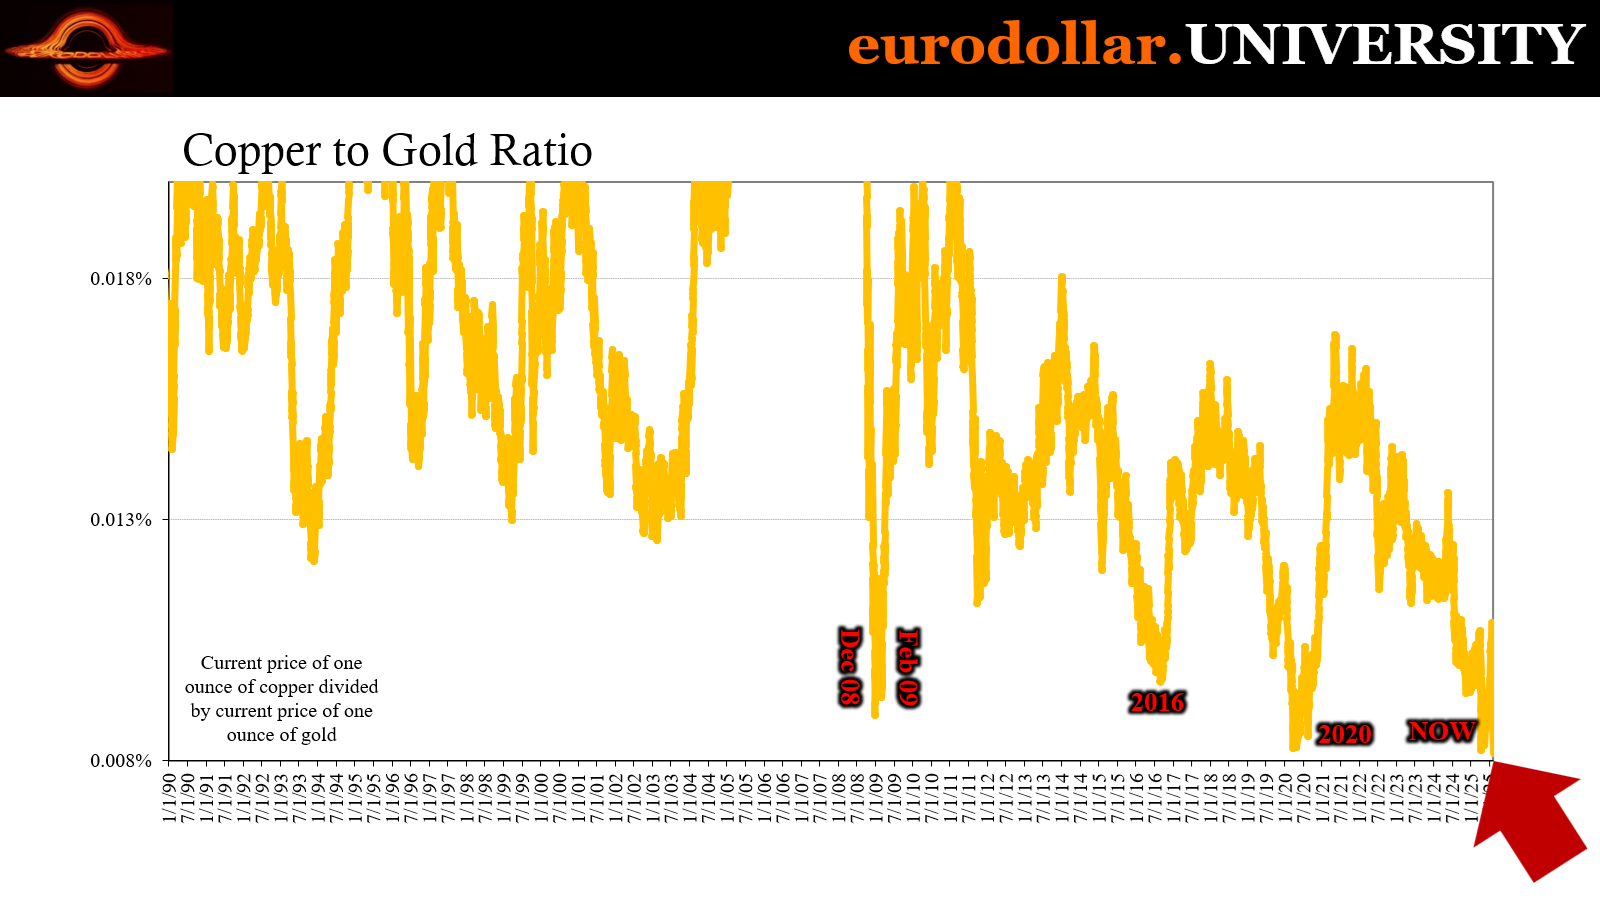
The ratio squeezed up to around 0.011%, rather high for the times. What we really wanted to know while that was going on was where the ratio “should” have been had supply not gone off the deep end. I expected we’d only begin to find out tomorrow when the markets finally reached the tariff deadline, and supply started to normalize.
However, given the surprise, the harsh reaction sent the contracts back down closer to $4 than $5 after being close to $6 just days ago. Now we have to wonder if the sell-off might be overdone on the downside. If not, if the real state of demand in the material space is $4.35 or $4.40, that’s a huge negative when compared to gold.

As of today’s prices, the ratio plunged to 0.00815%! How low is that? The worst in March 2020 produced no less than a 0.00825% number. Lowest for 08-09 was way up at around 0.00894%. So, yeah, this is a terrible result, so here’s hoping copper really has overshot to the downside for this short run.
Even if it has, though, it doesn’t push the metal back up to where CtG gets to some different comparisons than 2008 or Spring 2020. Most people naturally have trouble comprehending something like that given how we have 3% GDP and positive payrolls (maybe), not to mention repeated all-time highs for major stock indexes. It doesn’t seem like the copper to gold ratio itself is behaving rationally.
It’s not a crash indicator
The comparison with March 2020 or late 2008 is what throws a lot of people off, and for understandable reasons. To be even close to that company immediately seems to imply the market is preparing for similar calamities, those godawful proportions. That’s not what CtG is indicating, however, in the same way record negative swap spreads aren’t signaling a monstrous bank crisis or pandemic repeat.
Since copper is the fundamental upside in the economy when prices are up, outside of supply squeezes, a low ratio starts with a lack of any upside potential as seen through the metals market. Higher gold might signify liquidity crisis potential, though it doesn’t have to, either.
So, this ridiculously low CtG ratio is more aligned with the kind of future priced by record negative swaps spreads. Since the latter are, in literal terms, pointing to a long run future with very low interest rates which remain low for the long run, they could mean bank panic, full-blown deflation and huge economic crisis.

More likely, though, just a bleak future where stripped of any upside which leaves the economy struggling as it falls further and further behind.
Similarly, CtG at such low ratios in and after 2008 were more about the long run potential which followed the not-recession than the crash itself. Again, no upside which held copper prices lower compared to higher demand for gold as financial protection not against inflation – that would have meant a greater rise in copper than gold.
That’s the comparison this new multi-decade low is advising. One where inflation won’t occur, where there is no positive potential in the economy same as the 2010s, against which the overall system simply falls farther and farther behind leaving almost everyone in it comparatively worse off. This scenario is perfectly consistent with both the rupee and the swap market spreads.
It’s not just about depth or downside, either. Those are important perceptions, sure, but we also have to keep in mind confidence. The more confident the market is about those scenarios, the lower the CtG ratio will fall like swap spreads. As it does or they do, that’s just the market saying there is less and less chance of avoiding the macro (and monetary) fate.
We don’t even need to see a crash to get there, either. Here in the 2020s, it’s not just the previous Silent Depression to deal with, we also now have the negative consequences of the pandemic and the economic damage left in its wake, as well. All downside, no upside is more than bleak enough to fit with what all these same signals are signaling.
That is where the comparisons in swaps or CtG with 2008 or 2020 really apply.
India canary
One minute, it seemed, India was leading the world on a reflationary course. Or, maybe just its own. The rupee had staged a massive turnaround, rising from record lows in February. It all seemed to be going right for once, including for the RBI following its much-maligned currency interventions especially in NDFs (non-deliverable forwards, or non-monetary speculation markets).
The reversal, as noted a few days ago, was the usual slow rounding off inflection, rather than a hard about-face. However, after almost two months of moving lower again, given the other fundamental background challenged facing the eurodollar and the global economy there was too high of a chance INR might revisit those prior lows in a hurry.
That revisit was indeed condensed into just a little over a week. As of yesterday, the rupee plunged, too, almost breaching 88 to the dollar and enough to set a new all-time low. The fact it came against the backdrop of swaps, copper, gold, and numerous urgent questions surrounding specifically India’s suddenly disinflationary economy was not coincidence.

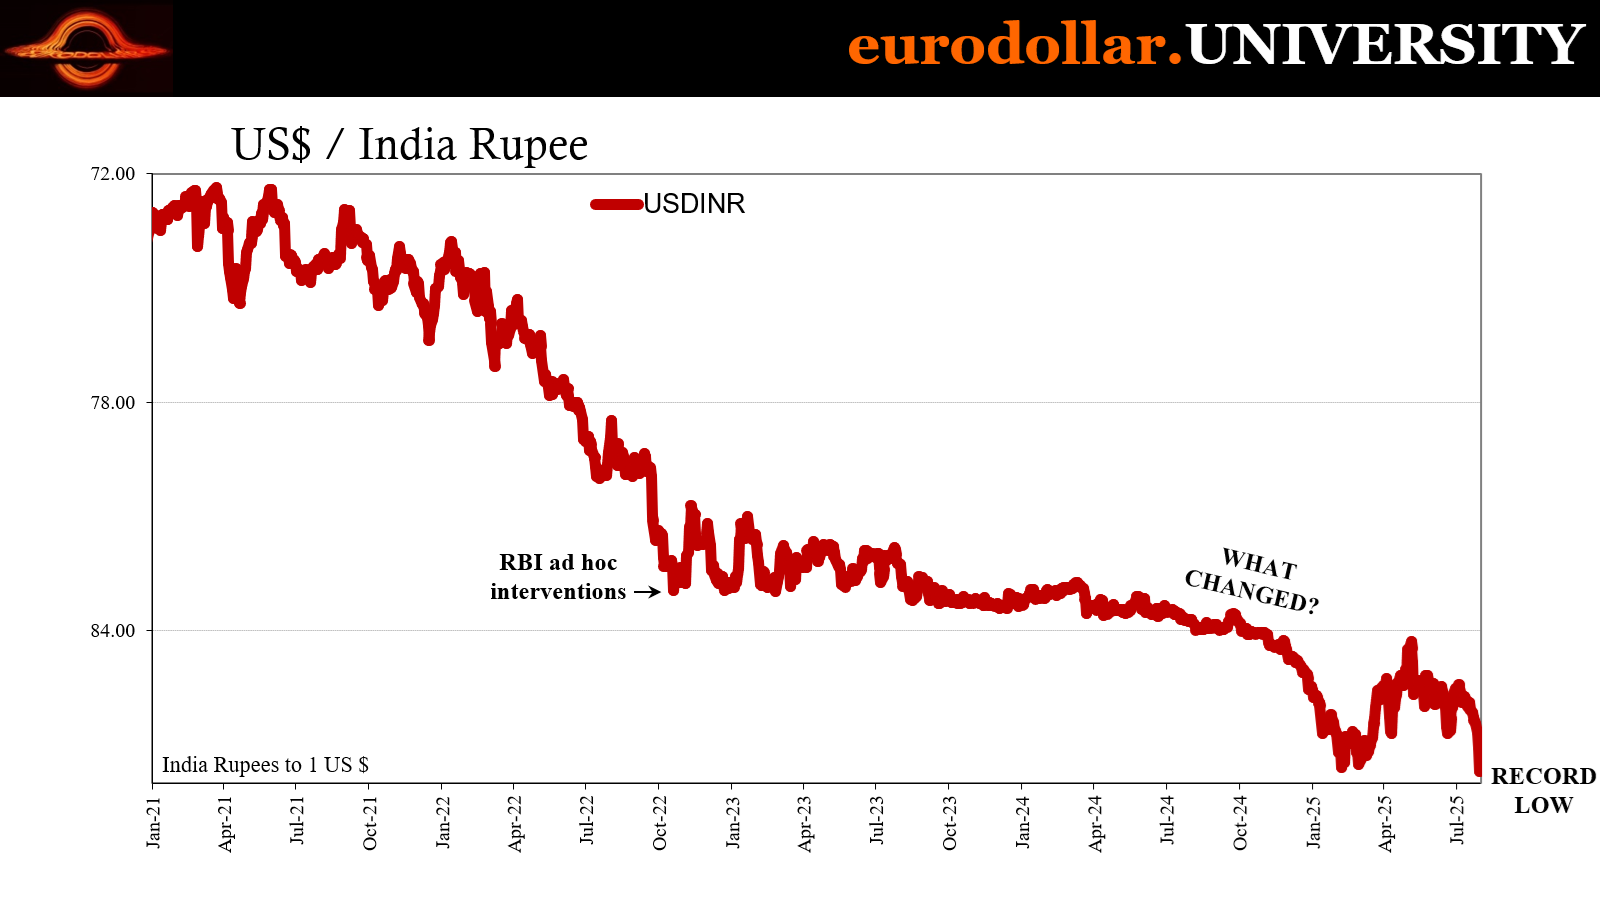
INR is one of those early signals that you have to pay attention to. When the rupee began to reverse higher a few months ago, that was worth investigating as potentially suggesting a reflationary way out of the increasingly global mess which had been developing from the final few months of 2024. Had it obtained corroboration in any other key eurodollar signals, it would have meant taking the possibility of a broad global reversal very seriously.
That confirmation never came, however, which seems to have meant INR was rising for other reasons. Some of it was due to local conditions, how, for a very short time, India was thought to have the easiest path to a trade deal with the US, or that its slowdown last year was a minor downshift for a red-hot economy and wouldn’t get worse.
Those possibilities didn’t last long in the market, and now with the currency exchange value back down at a record, rather than plot a preliminary path out of the deflationary darkness it proved there wasn’t one and India was going to be globally synchronized after all.
Globally, INR has been an early warning, as I said. To flop this badly this quickly is not a good sign for the near term and then going beyond it. In light of the rupee’s action, maybe copper’s crash and its impact on copper to gold isn’t overdone after all. More corroboration.
Transfers again
Yes, Q2 GDP hit 3%. No, it wasn’t a legit 3%. The details underlying the headline show that well enough, how consumer spending has clearly hit the proverbial wall, or at least having gotten very close and acquainted to it.
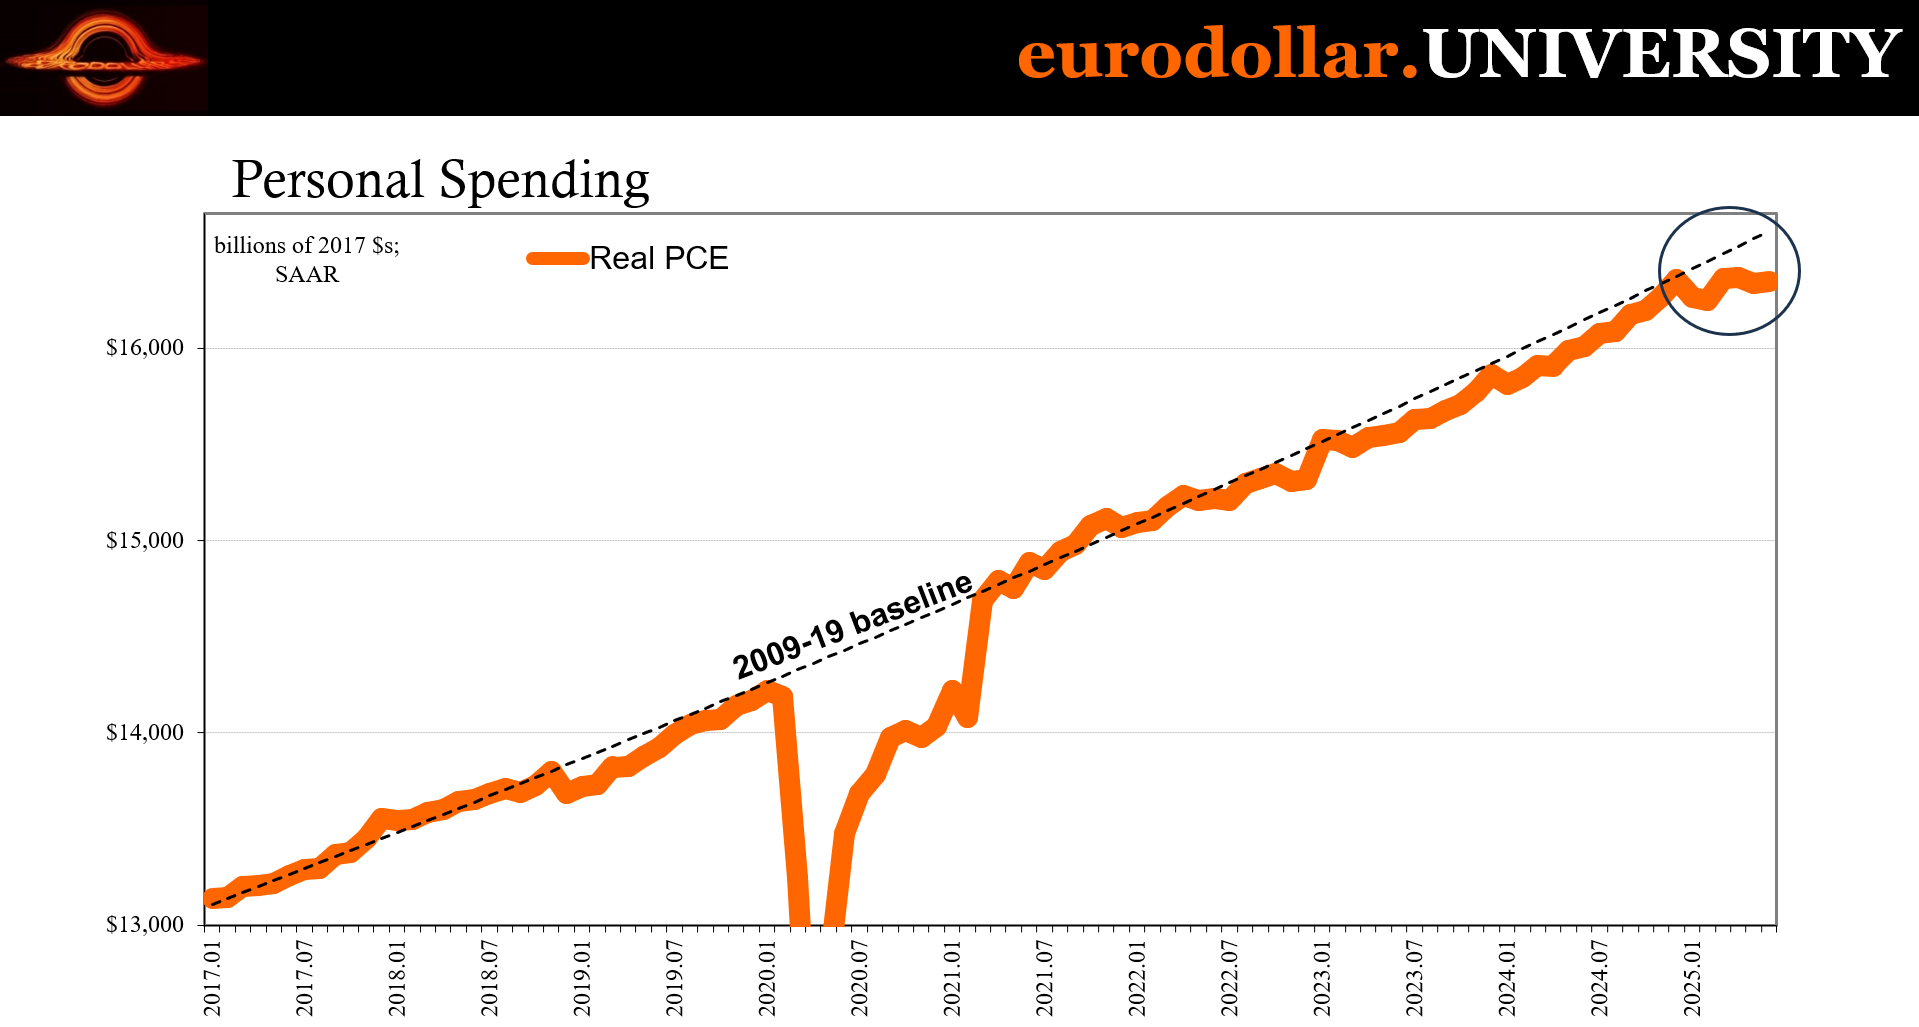
The BEA’s monthly figures add more to the story, first on the spending side leaving no doubt the entire macroeconomic complexion has meaningfully changed. From nothing more than a visual inspection, you can absolutely and easily see how that has been the case. PCE, or personal consumption expenditures, were rising at a relatively steady rate if slightly below trend and then abruptly stopped right as this year began.
Everything that Economists and central bankers fear is now right there out in the open in the Gold Standard for economic accounting, the data from the BEA. Nothing is left to interpretation with this one.
I wrote yesterday how even the FOMC statement itself was forced to address it. Yet, Fed Chair Powell chose to downplay it anyway. By doing so, what actually did was further reveal his true agenda, his real aim where it comes to his relative hawkishness.
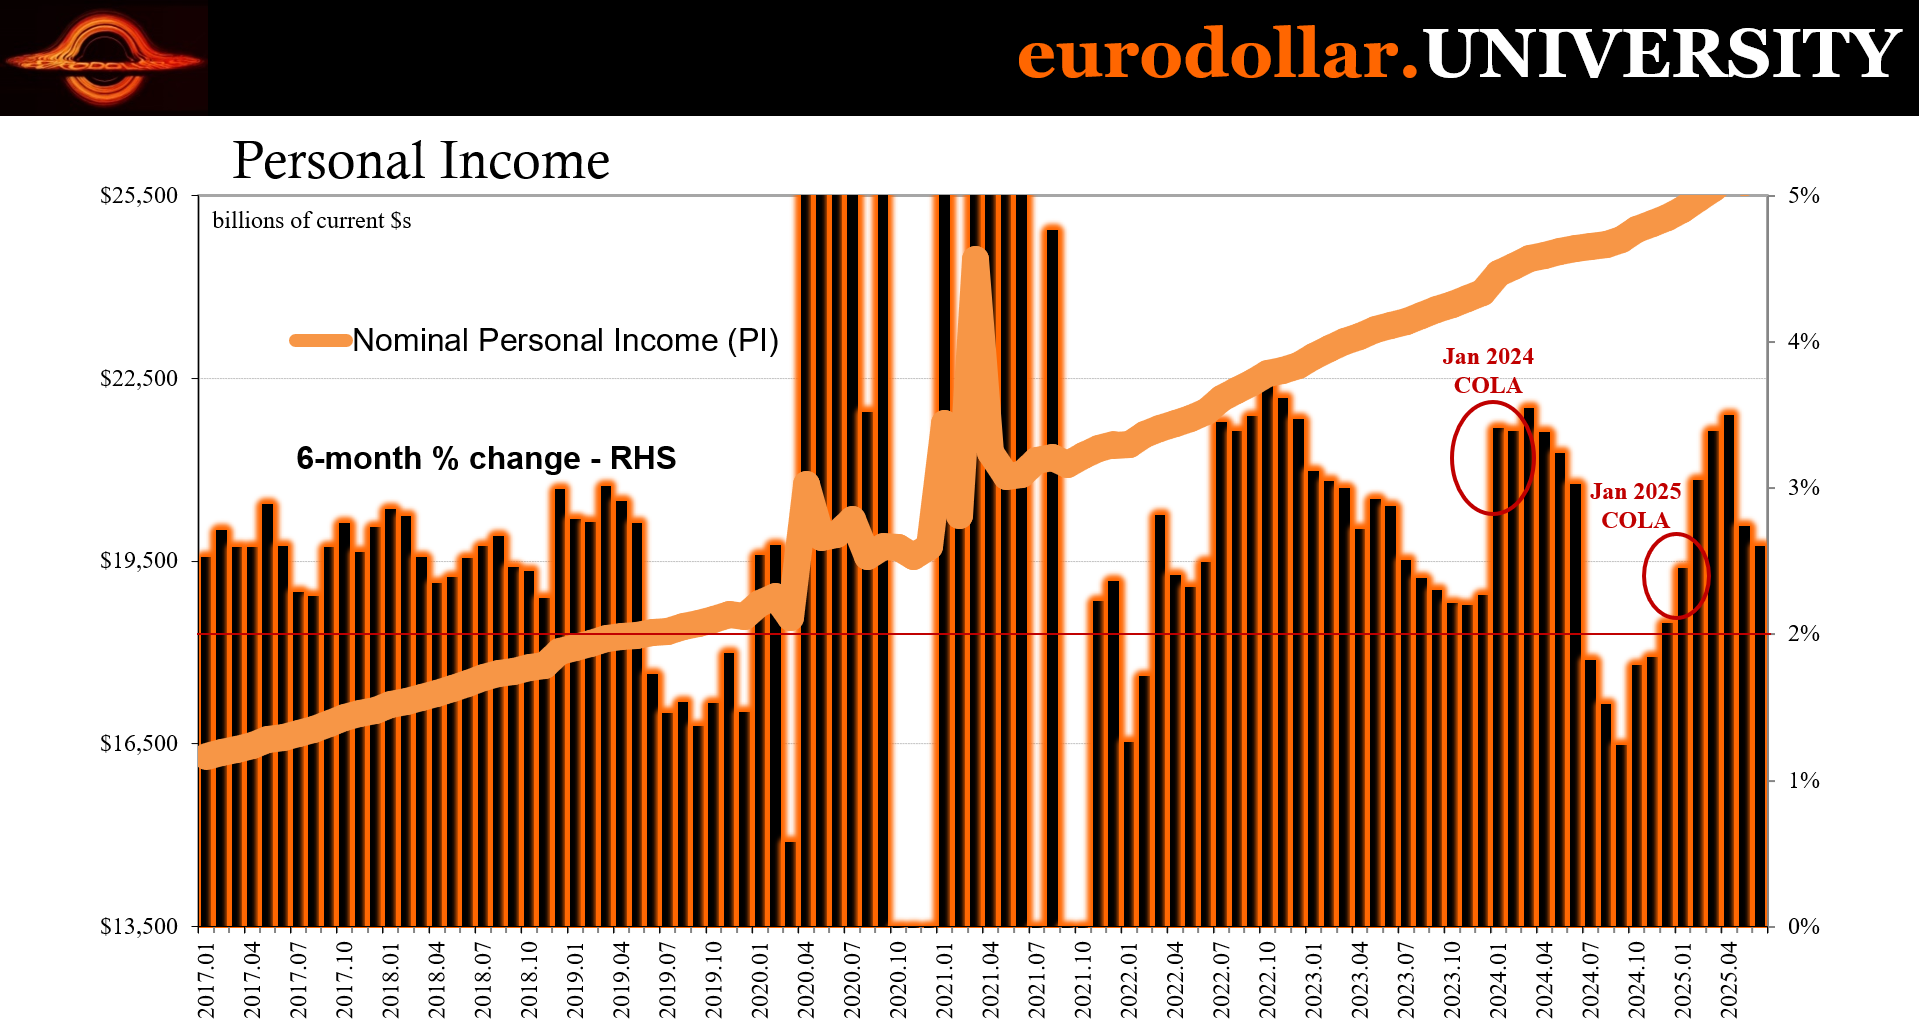
More importantly, though, in the real economy the BEA’s data also shows why. I mean, we know and have known why all this time – labor difficulties that are compounding. The monthly personal income stats merely confirm those in yet another way. American consumers stopped spending the way they had because incomes just aren’t there, especially when adjusted for price changes while also accounting for transfer payments from the government.
The latter made another large contribution in the latest figures for June 2025. Total Personal Income (nominal) rose by 0.28% on the month after falling by a revised 0.39% in May (SSA payments coming down from their April surge), so already not great. Taking out transfers, however, the remainder of nominal incomes was basically flat, +0.08% m/m following a slightly greater 0.11% m/m decline in May.
That makes two straight months with essentially zero nominal income growth. Nominal. Transfers won’t make up for that, especially when they come in the form of Medicare reimbursements or similar.
And even transfers were straight up cash payments, they still wouldn’t have been nearly enough to offset the clear weakness in private incomes which would – and did – have a chilling impact on consumers’ outlooks and therefore consumer behavior. The labor market itself really must have been more like the Household Survey (which crashed in May then failed to rebound much at all in June) to have produced negative nominal private incomes.
This also corroborates the high degree of weakness we highlighted from the BLS’s Establishment Survey, the highly unusual decline in nominal average weekly earnings. There are simply too many of these atypical minus signs in key data series to take Chair Powell seriously on the labor market.
Adjusting for prices, Real Personal Income excluding Transfer Receipts fell in June by another 0.16% after declining at basically the same rate, -0.17% m/m, in May. That makes four declines in this critical series over the first six months of the year, and if not for the large jump in March the entire series would be down in that same timeframe. As it is, the near-zero increase for a half year is, again, highly unusual.
Incomes are weak because the labor market really is intent on visiting the flat part of the Beveridge Curve, corroborated by all these independent and top-tier sources with only Jay Powell’s word and payroll report’s unreliability indicating otherwise. From weak jobs to weak incomes then naturally weak spending, the proverbial consumer wall has been unmasked with a clear inflection and change of behavior for 2025.
All these distressing US macro signals, of course, are entirely consistent with a ridiculously bad copper to gold ratio, with swaps, or next to rupees: an economy with zero upside, growing downside risks, already having fallen very far behind for all those participating in it.
This isn’t just overseas economies we’re dealing with, perhaps putting the final explanation on why CtG like swaps or INR have gone done as much as they all have, going farther down than March 2020 or late 2008. Having the US not be the cleanest dirty shirt with everything that has happened, rather as soiled and darkening as everyone and everywhere else, really does drive home no upside and an even wider and widening gap to what would count as minimally healthy.
Especially when what’s left standing against that potential is nothing more than Jay Powell’s word and the NASDAQ.