BILL GETS REVISIONS
EDU DDA Dec. 3, 2025
Summary: It’s time for a rant on a topic that has bothered me for a very long time. It has forced its reappearance at a critical time, too. While it might not seem like a big deal at first, this goes straight to the heart of the biggest factors the economy and the world are wrestling with as we close out 2025. The background for this discussion is more confirmation of job shedding in the US economy. As a result, bills are all-in on next week’s rate cut.

THAT’S NOT (A) SMALL CHANGE
Yep, they f-ing did it, pardon my language. This will be somewhat of a rant today because the Fed just did it. And I knew they would once I saw the schedule of releases. One of my biggest pet peeves has made its reappearance and right in time for everything that is going on these days. Having claimed for a long time the economy was good and strong, recovering nicely, only now do we get the numbers showing otherwise.
For those of you who have followed me since the early days at my former firm (Alhambra) may already know what I’m going on about: benchmark revisions. These aren’t merely academic, dispassionate bean counters who are going back to correct the record with higher-quality data.
The data is the data, yeah right.
If it agrees with itself, with other accounts, and, most of all, with the marketplace (obviously not stocks) then, sure, the data is the data. However, when the numbers look better than curves might picture, that’s reason to doubt the numbers. Instead, “authorities” claim it’s the opposite. Trust the Fed’s IP stats even if the bond market doesn’t buy them (which leads to more bond being bought).
Only to find out years later curves were right the entire time.
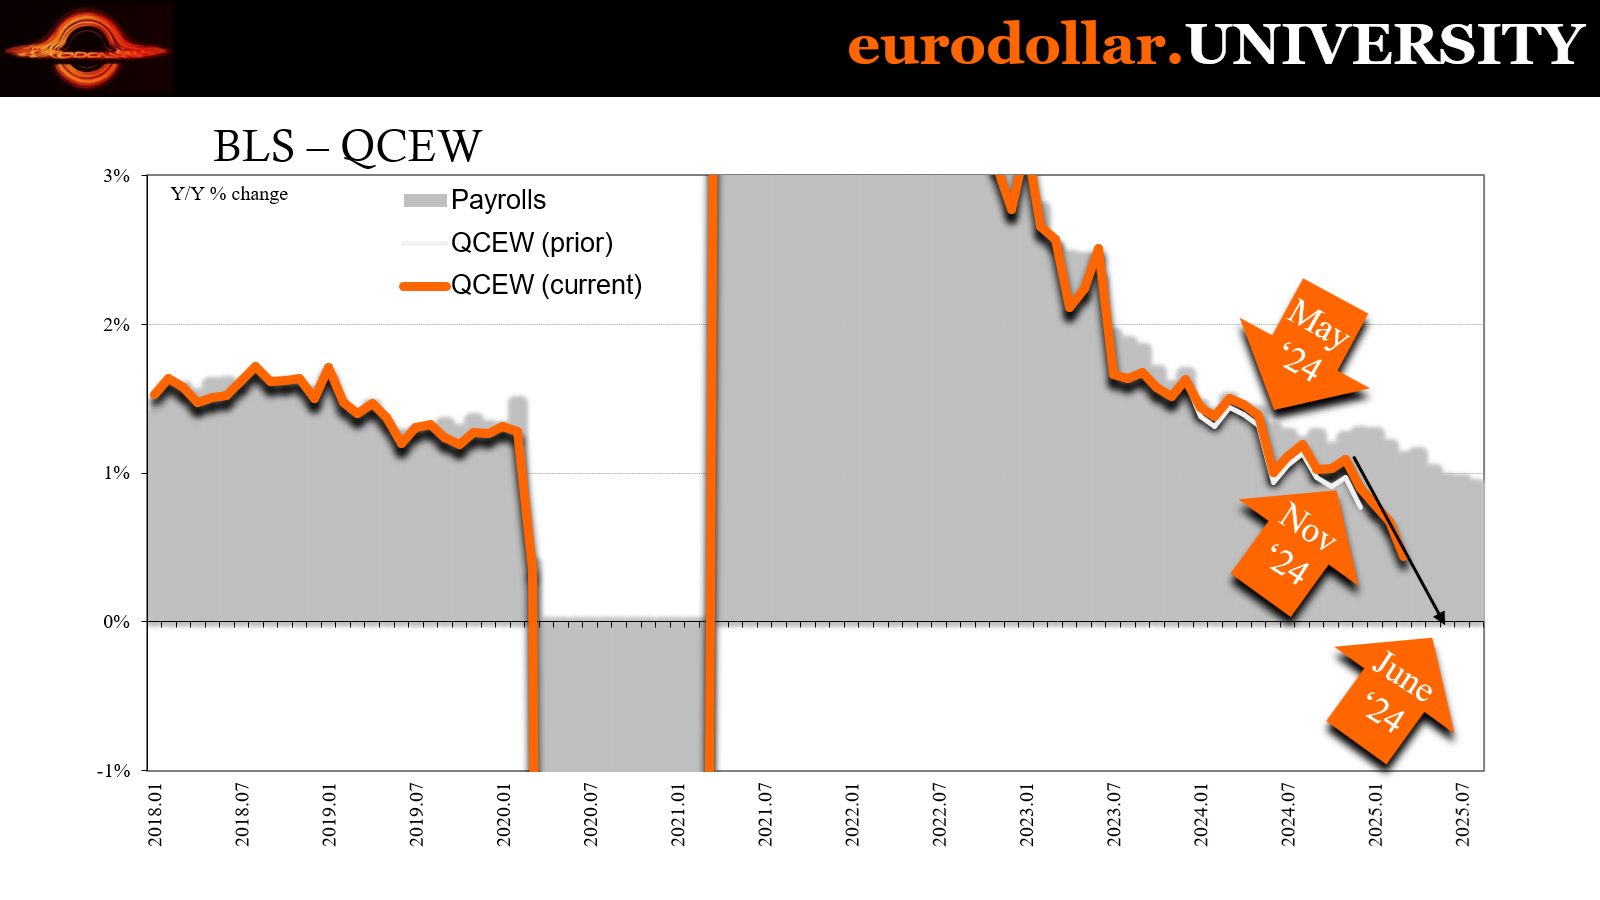
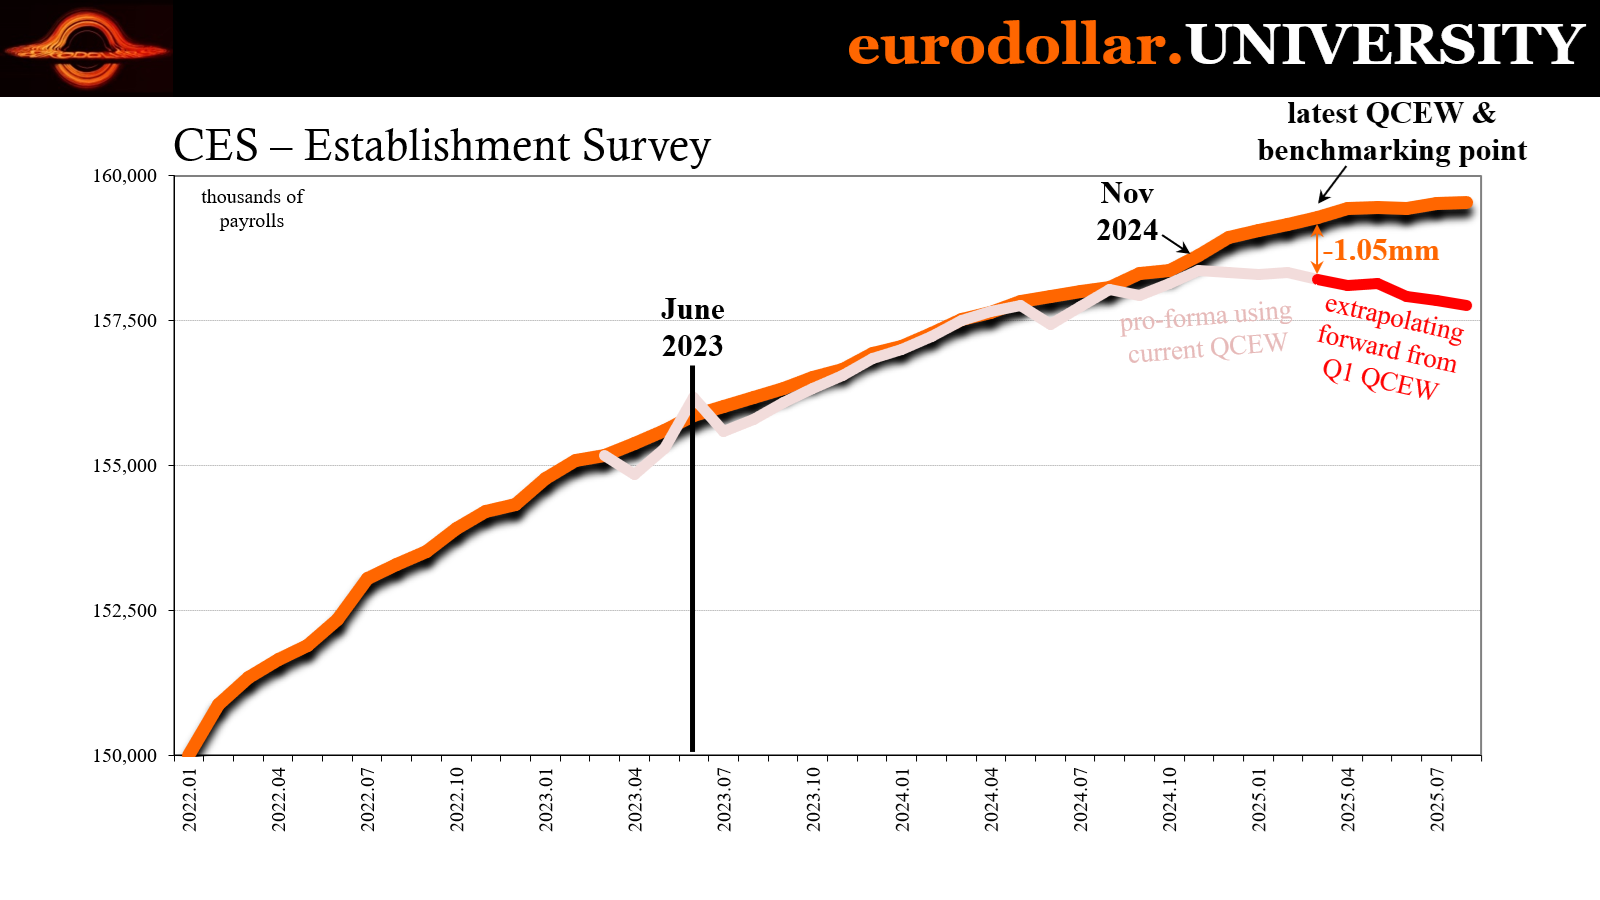
We’ve been entirely too familiar with this problem in the form of the BLS’s CES which we already know will be corrected by the QCEW. The Federal Reserve just massively revised IP and particularly the production of consumer goods (seems highly relevant to the past few years, no?) What makes it worse, this is almost an exact carbon copy of what happened at the last inflection couple of inflections, too.
My overriding point: never forget that however the data appears today the situation is almost certainly worse in reality. Not just payrolls, too many accounts have been susceptible to this trend-cycle overstatement. Just this year we’ve seen significant downward revisions to retail sales already. That’s what any rational person would call a pattern, a pattern of overestimation.
Before digging in to the latest statistical tragedy, first we really do have to note more flat Beveridge data and how it has indeed transmitted through T-bills into what will be next week’s rate cut. It’s practically a done deal at this point, an outcome which is only further punctuated by what is only the latest revision debacle.
Confirmed job losses
ADP’s monthly update for November ended up being the third negative month out of the last four, and fourth from the past six. Maybe most important, the 6-month average slid to just under zero, the first negative for it since late 2020. In other words, according to ADP’s data there is almost a 100% chance the US economy is losing jobs. Tariff inflation is vague idea, labor weakness is being widely, uniformly validated.
Turns out, it wasn’t a one-off from the summer after all. Not only did the losses extend into November, ADP’s latest estimate, they do appear to be accelerating, too. Not crashing, yet more than enough to confirm the overall transition to some level of flat Beveridge where any level is danger.
You don’t end up with four negatives in six and a minus for a six-month average otherwise. This goes beyond any reasonable threshold eliminating the chances of statistical fluctuations or even real economy anomalies (which do happen, as you see for March 2023).

While the FOMC won’t have any “official” jobs numbers before the bird factions gather starting next Tuesday, together with what the BLS has already put out these ADP figures should be more than enough to clinch the December rate cut almost everyone was convinced (including worthless fed funds futures) had been erased by Kansas City’s finest just a week or so ago.
Recall what Chair Powell had said at his last press conference, the one at the end of October which kicked off this media frenzy hawkishness over inflation fears. He didn’t say December wasn’t live, only that he would not commit the entire FOMC to it largely because the Schmid group wasn’t convinced the employment declines which “unexpectedly” began popping up in later summer were real or represented anything substantial.
As far as they were concerned, maybe it was all just a temporary soft patch, a one-off of jobs lost due to immigration enforcement or something.
Put that theory to bed; ADP – corroborated widely – shows the job shedding extended beyond what was supposed to have been a short window to now through November. Worse, the losses appear to be picking up a touch, too.
Given the Beige Book already, KC Jeff has even less to stand on next week than the nothing he had last week. The Fed staff is on the side of ADP and Challenger Gray, as is the more than “many participants” among committee members who are worried over the state of jobs. Governor Waller, for example, has been pounding the table about just this possibility, which means he’s going to carry a lot of the discussion while Schmid meekly sits in a corner and talks about possible future price changes that maybe could possibly might happen at some point in 2036 or thereabouts.
The guy will probably dissent anyway, but it won’t matter.
This isn’t meant to be a running commentary on bills, but the move they’ve made the past few days deserves the ongoing focus for this reason and this is probably the last I’ll mention of them for the time being since they’ve largely settled any lingering doubts. Bills aren’t some derivative market or hedging technique based on illiquid hearsay (as in fed funds futures), either, we’re talking real money investors of real size and reach.
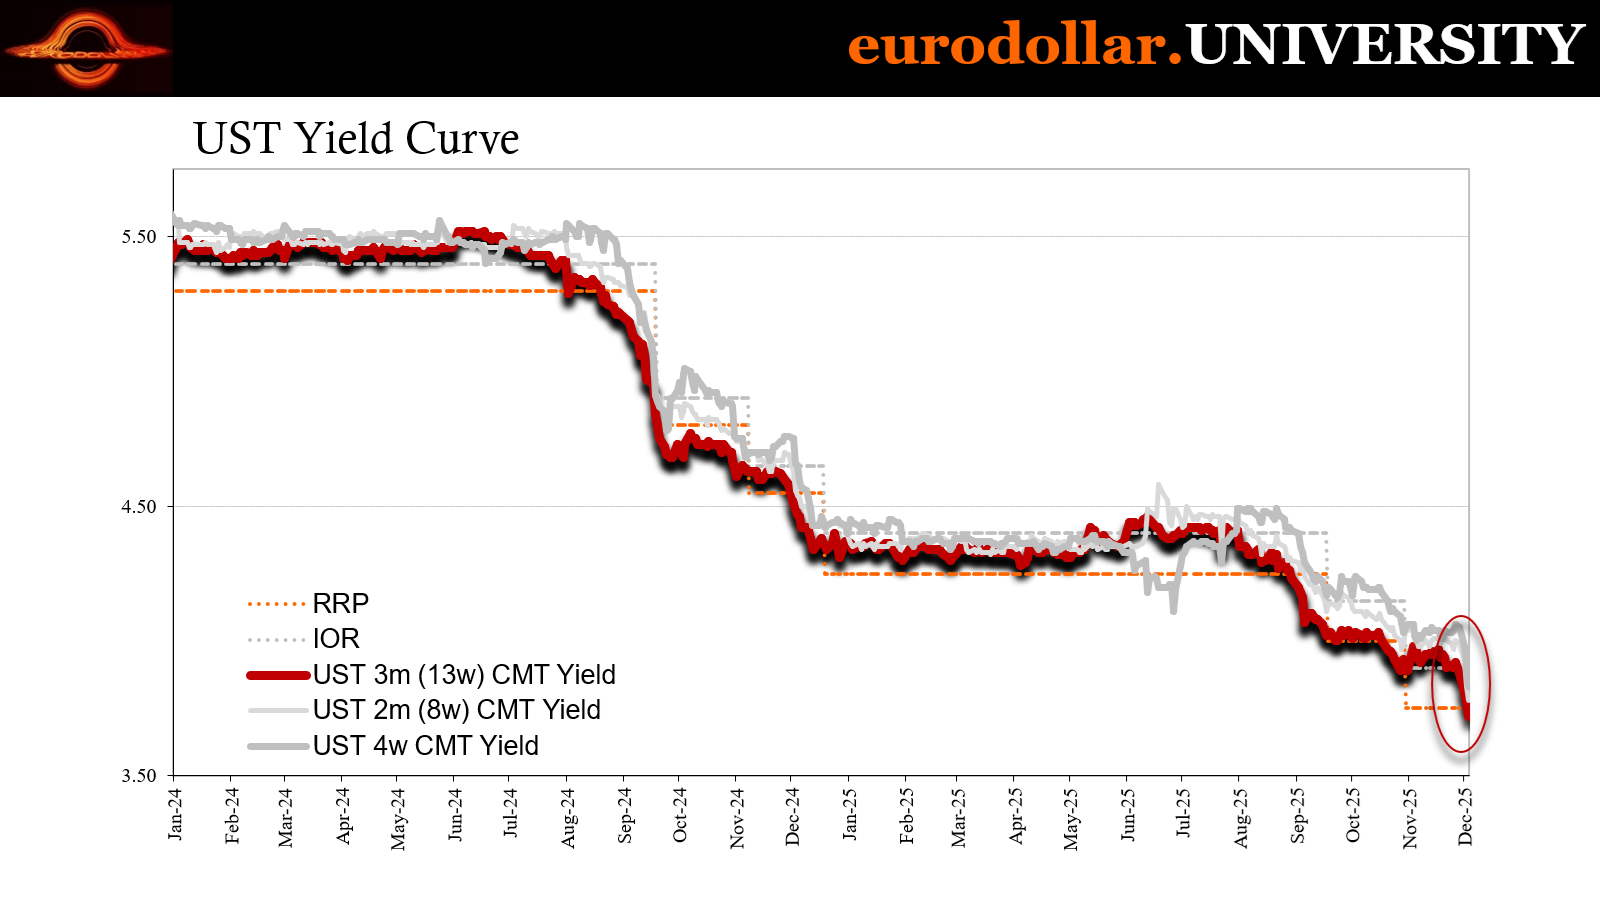
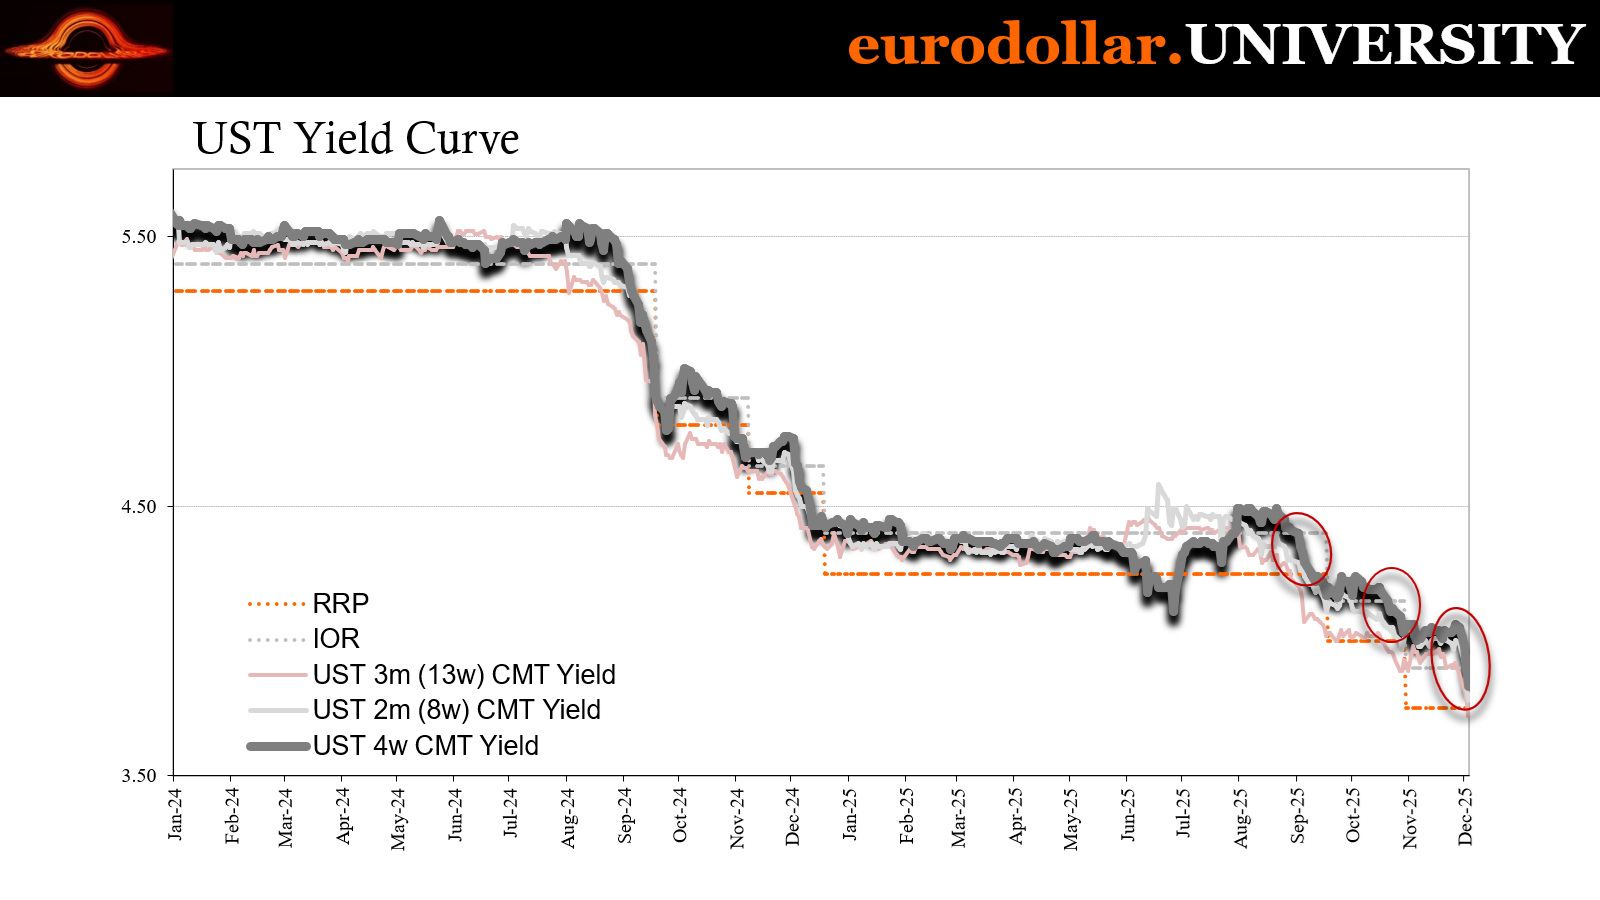
Bill’s verdict as clear as you’ll see.
The 4w instrument has shed a mammoth 22 bps in just the last three sessions! That’s enormous for any bill, let alone the very front tenor. Sitting at 3.83% with still a week to go before the rate cut, there’s no ambiguity in the buying.
Same goes for the other maturities, all of them out to 6m. The benchmark 3-month equivalent rate now sits at just 3.72%, having dropped by 25 bps since the 17th, with 16 bps coming off just in the last three trading days.
Bill is telling you what as ADP shows you why.
No ambiguity, gray areas, or confusion. No tariff inflation. Just flat Beveridge and the predictable Pringle-y response from the Fed to it.
Here we go again
Why do economic data providers continue to overstate reflationary periods? This is more substantial than a pet peeve, though to many if not most it might seem like splitting hairs. We’ve seen this happen repeatedly with each eurodollar cycle. The data errors contributing at least something to the confusion and narrative mistakes, yet the same keep piling up even today as if no one learns from them.
Because they don’t!
Rather than revaluate why these exaggerations continue to happen, they’re all content to trend-cycle their way to higher-than-deserved numbers. If I was susceptible to conspiracy, this would be one, not to make presidents or politicians look good instead Economists and Economics. In the 2010s, it would have been to validate QE as maybe finally effective. Here in the 2020s, to bail out the COVID bailouts with unearned economic validation.
Under the light of revision, we see more clearly they didn’t work.
Even then, the stats weren’t great to begin with. That’s why we have been calling it forgot-how-to-grow. Turns out there indeed had been a lot more forgetting going all the way back to that initial pivot point, right in 2022.

Not only does it show bonds were right about weakness, also they were correct in pricing why it happened – not rate cuts, rather the supply shock driving demand destruction. People couldn’t afford the pricey economy produced by what was said to be a red-hot recovery.
High frequency data in order to be high frequency has to be gathered from a smaller sample size. Nature of the beast. This, however, leaves open a more than a trivial chance of allowing imprecision to enter and taint the data. Add to this subjective application of statistical elements, particularly the oft-misaligned “trend-cycle” component, suddenly bigger revisions have become entirely too common post-2008.
To put it simply, and what happened repeatedly during Reflation #2 (2013-14), was how these subjective and more error-prone process components helped fuel the idea that the economy was more robust than it really had been; adding some unknown degree of gravitas to the recovery narrative while it was undermined, correctly, as it turned out, by any number of real-time (bond) market indications.
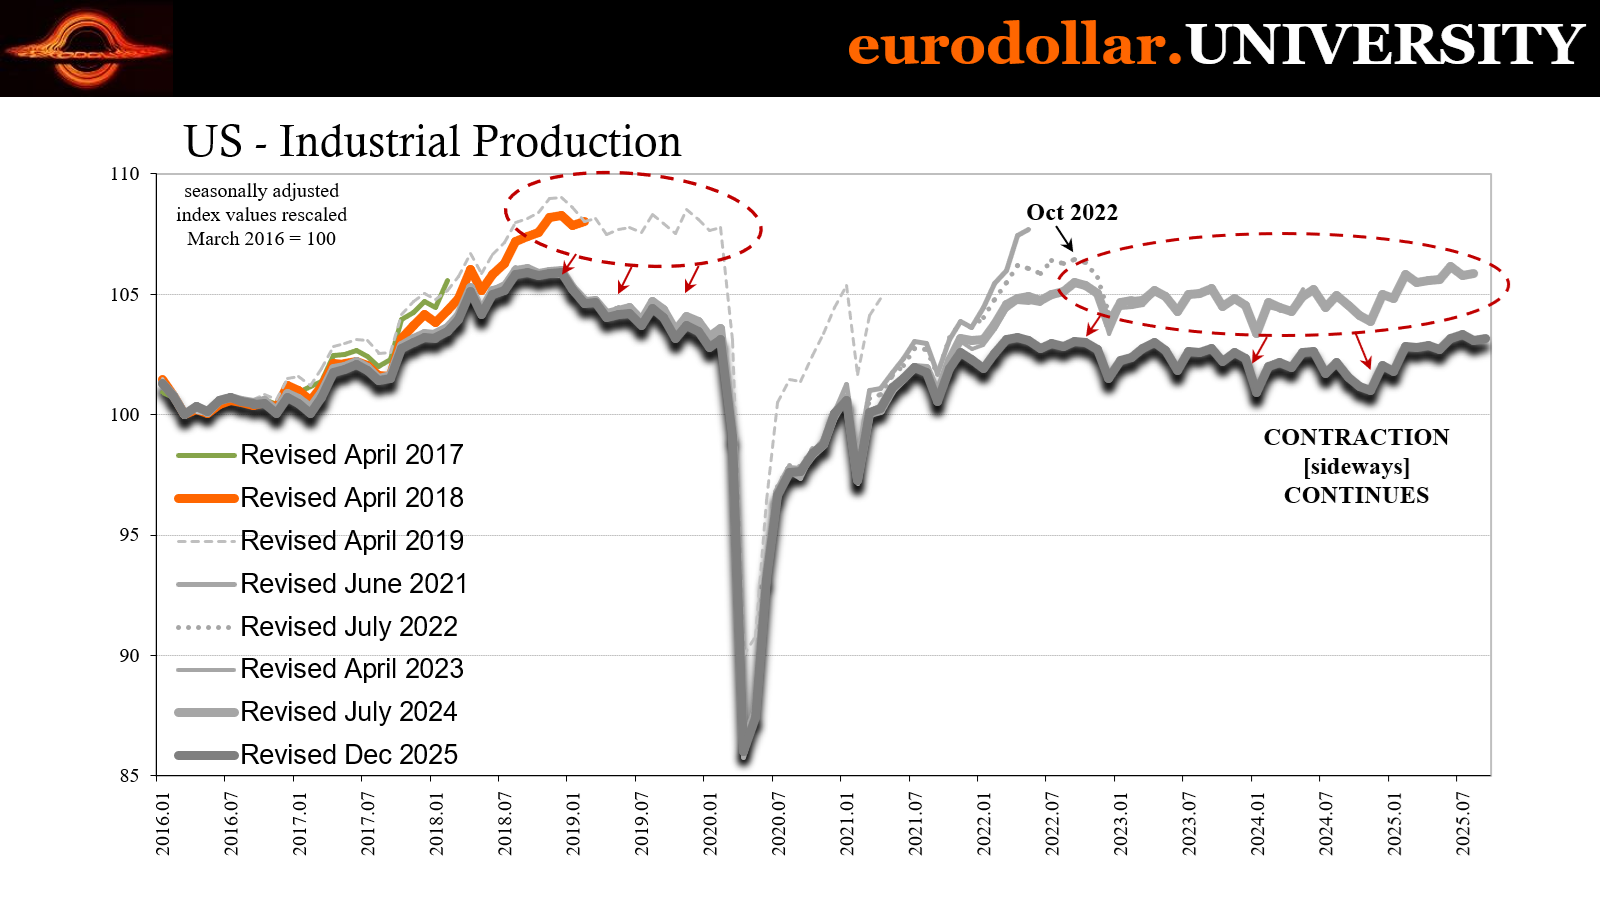
The worst offender was (and remains) the Fed’s Industrial Production numbers. Big swing and a miss, particularly for the production of consumer goods. That would seem to be a big one, don’t you think? If producers were in truth producing a lot less for consumers, that would further establish what those producers in the real economy really think about the state of consumers and, by extension, jobs, incomes and everything that is important.
What was a recovery-like rebound after 2012 in the original data runs got whittled down benchmark revision after benchmark revision so that in the end – and only years afterward – do we find out the awesome economy of 2014 poised for liftoff was nothing of the sort; moribund and still grounded the whole time just like the flattening yield curve priced while it was happening.
The high frequency data is supplemented in this way because the government’s statisticians know their own weaknesses.
To come up with gross US retail sales, for example, the Census Bureau doesn’t sort and count up the retail receipts from every single transaction completed by every retail outlet across the economy. They start with a monthly sample, called the Monthly Retail Trade Surveys (MRTS), and then each year supplement them with a broader survey drawn from a much larger population called the Annual Retail Trade Survey (ARTS).
From ARTS, the previous year’s MRTS estimates get adjusted according to the more comprehensive lower frequency set.
And then every five years ARTS are indirectly attuned according to the granddaddy of them all: the Economic Census. We already saw the results of that in significant retail sales revisions earlier in the year.

What we keep finding is that the higher frequency data has trouble picking up on and accurately picturing after the eurodollar-based downturns. When the benchmark revisions were published in May 2015, for instance, retail sales estimates were revised significantly downward, too. Though they only amounted to what may have seemed like a pittance, a few billion in sales that never happened each month for a series where total sales run into the hundreds of billions, it really does add up and add something to the overall picture.
Only after several years did the benchmarks fess up to the reality. Those low and falling Treasury yields in 2014 into 2015 had more of a point – in data terms – than it had seemed back at the time. Less reason to listen to Bernanke then Yellen, too.
It is a big deal
At first it may seem like, what’s the big deal? But imagine how maybe things might’ve been much clearer had the new benchmarks been in place contemporarily. For the month of October 2018, a particularly crucial month given what was about to happen (landmine), back then it seemed like retail sales growth was slowing a bit (the 4.6% annual rate shown above) but nothing really amiss.
This was the official line, if you recall: a minor slowdown from late 2017’s booming boom, thus no bother to Jay Powell’s inflationary forecasting replete with the appropriate rate hikes galore.
By that October retail sales were in actuality (or closer to it) up just 2.7%, or a 3.3% annual rate which is very close to recession territory and thus a what should have been a little more alarming for Chair Powell and the rest of the world not enthralled by the Fed’s appearance and position of (unearned) authority. Down toward that level would propose a greater likelihood of more substantial weakness – as eurodollar futures flattening and inversion and yield curve flatness were saying back then.

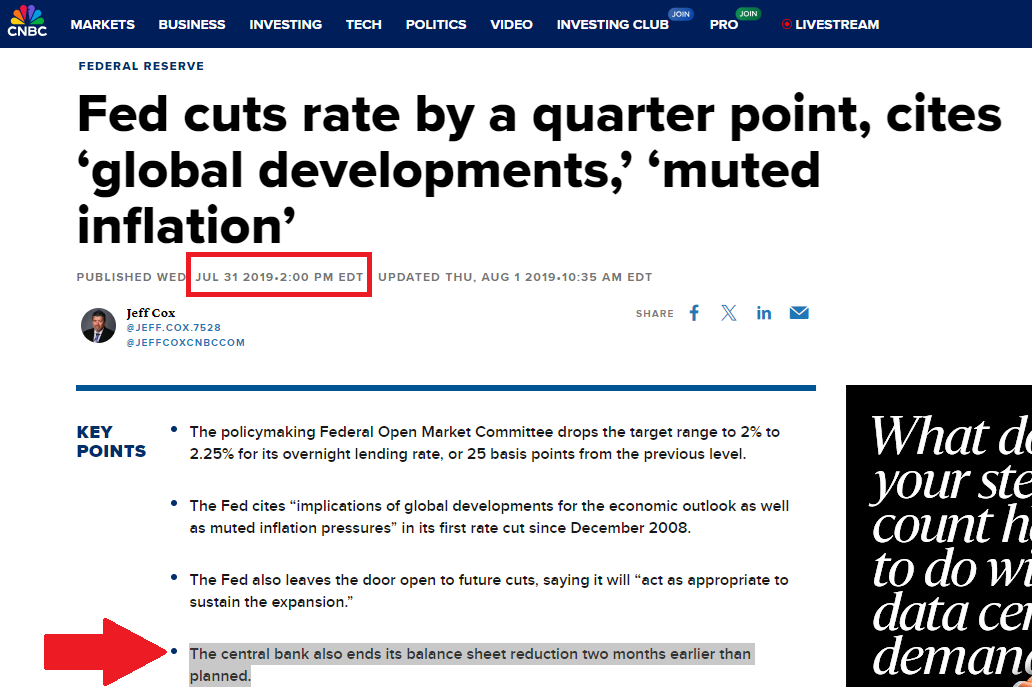
FED RATE CUTS WERE A COMPLETE SURPRISE ENTERING 2019 AND THEY SHOULDN’T HAVE BEEN IF THE DATA HAD BEEN MORE ACCURATE.
The landmine which immediately followed October 2018 caught Powell, the mainstream, and the Census Bureau by complete surprise when in fact a more realistic assessment of the economic data would have further backed up market skepticism about the supposed “boom” and more so how long it might have been able to be sustained (or not, as it turned out) given what really had been substantial risks to it.
Like those 2014 benchmark changes, by the time they get calculated and issued to the public, the public is already several years down the road and could not possibly care less, still happy today thinking back on the “good” times in 2018 therefore unable to properly assess how we remain stuck – year after year - in this disinflationary mess.
To that end, the revisions end up being worthless.
Thus, it’s more than a pet peeve. It’s a real problem. And it keeps happening. The bond market (not stocks) proposes weakness and the original run of data appears to be somewhere in the middle, ambiguous, only to be changed long afterward, several years into the future to show that, yes, curve were right all along. Risks weren’t just real; it was real weakness.
And it has happened yet again. Just take a gander at the IP estimates under the new benchmarks released today. They look almost identical to the inflection and eurodollar cycle in 2018-19! Same mistakes, no lessons learned. Always overstating the economy and in the same damn way.
Moreover, the biggest revisions came out for consumer goods once again. Consumers, the same group which has been under scrutiny for quite a few relevant reasons of late. Producers were never producing more for them under forgot how to grow, indicating just how little they thought of labor market and income potential for workers/consumers going all the way back to 2022.
Just to finish this rant off with some “hard” numbers, using the old benchmark the Fed had estimated total volume output among manufacturers through August 2025 was basically even with the prior peak way back in September 2018. That’s not good by any reasonable judgement, though within that gray zone where it doesn’t necessarily sound too awful.
After today’s benchmark, the Fed now says manufacturing output in September 2025 was more like 4.2% below it!
A MUCH DIFFERENT VIEW ON THE STATE OF CONSUMERS FROM INSIDE THE ECONOMY…
One last point – think about this from KC Jeff’s perspective. He thinks rates need to be left higher to restrain the economy to keep inflation pressures under control, to keep demand in check especially for goods. Never mind that’s not how any of this works. On his terms, in his mind, think about what the revision mean for Schmid’s framework: there was no need for “restrictive” rates since demand and indeed output was so much less than previously thought especially for consumer goods.
The economy wouldn’t have needed to be restrained because demand was never really there to begin with. Which means the IP data is now more in line with the CPI (ex shelter). See how this works?
And if it wasn’t there the past three years, why would red-hot demand suddenly show up tomorrow? Exactly what bills are asking and answering.
If anything, the Fed’s IP revisions, like those earlier from the BLS or Census and retail sales, further demonstrate why there was no tariff inflation from the very beginning. The FOMC can linger in waffles and bad theory for only so long before reality intrudes. Even the Fed’s own data is doing the intruding here.