Daily Briefing 5/15/25
Producers Price Index (BLS)
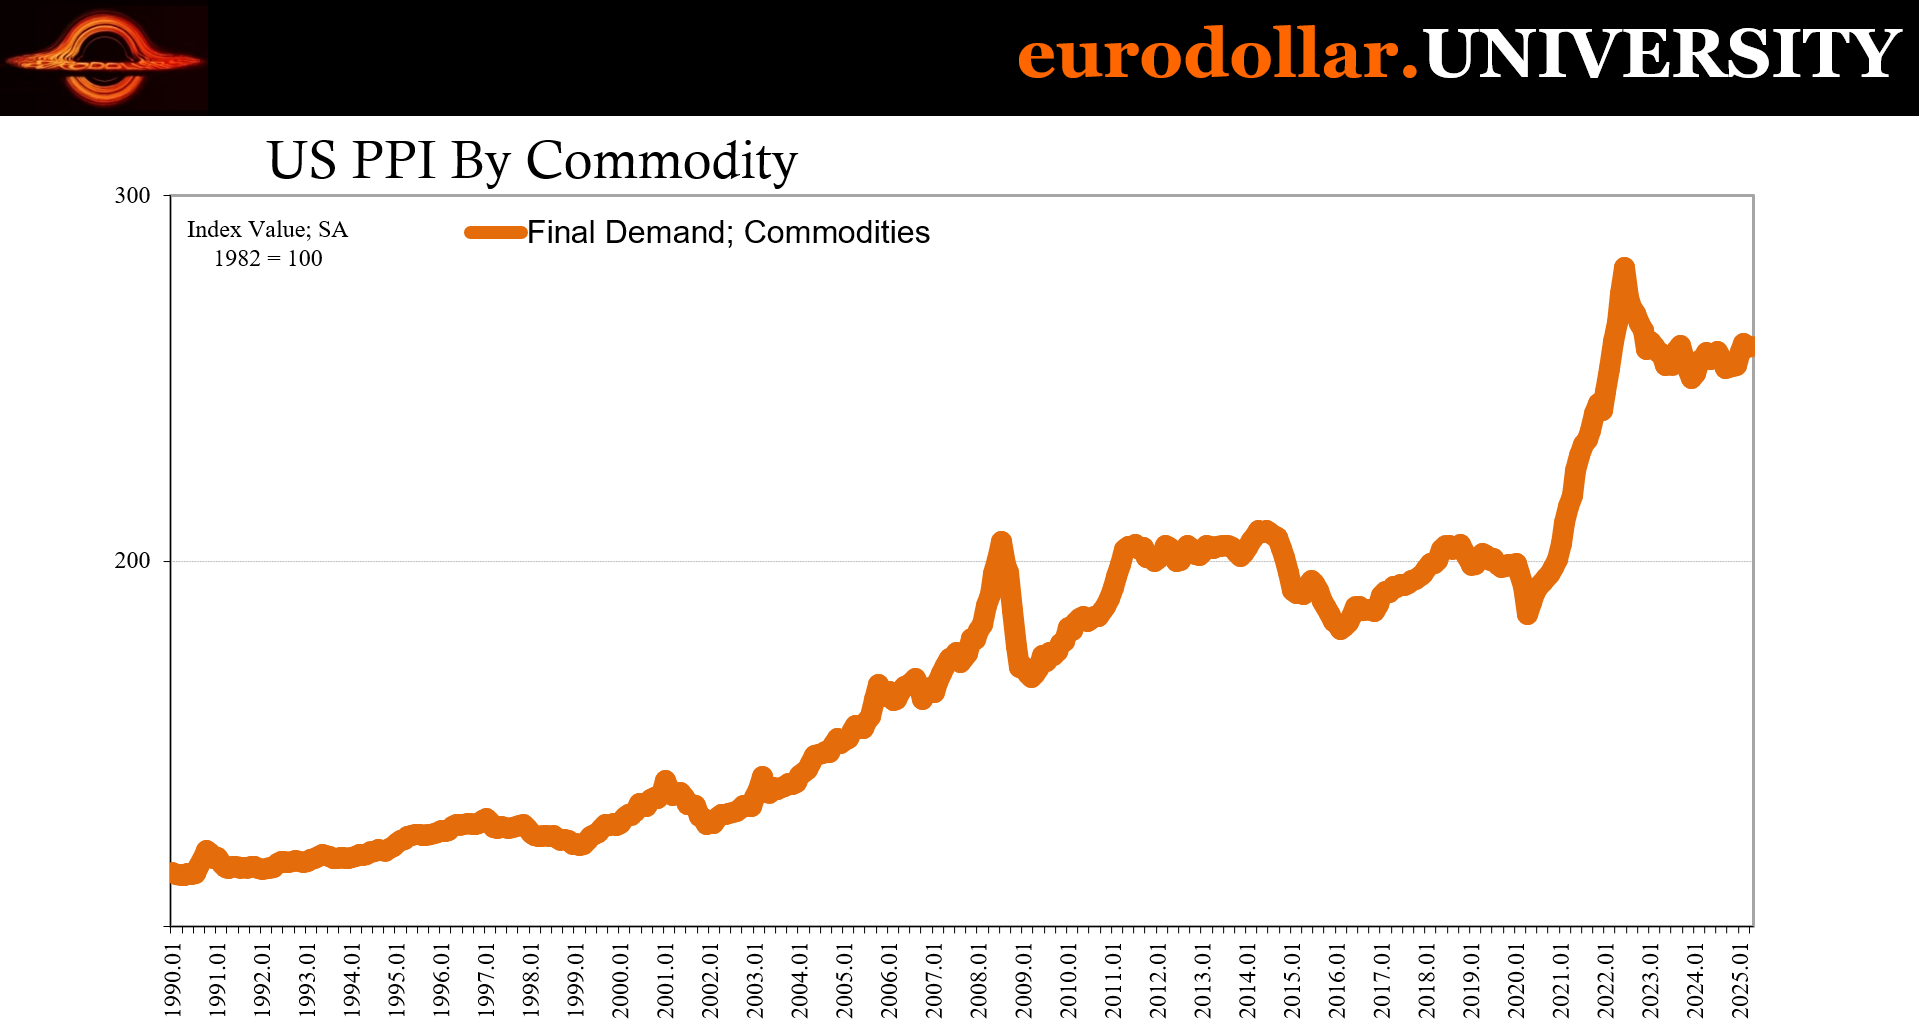
In April 2025, the US PPI for final demand fell by 0.5%, seasonally adjusted - the sharpest drop since April 2020 and the first decline since October 2023. This decline was primarily driven by a 0.7% decrease in final demand services (most on record), especially trade services, which fell 1.6%. Meanwhile, prices for final demand goods remained flat, as declines in food and energy prices offset increases elsewhere. On a 12-month basis, final demand prices rose 2.4%, while core PPI (excluding food, energy, and trade services) increased 2.9%. Prices at various intermediate demand stages were mixed, with some stages experiencing declines due to falling energy and input costs.
Interpretation
The April 2025 PPI report offers a significant signal of easing upstream “inflation” in the US economy, and not for good reasons. The headline figure - a 0.5% monthly decline in final demand prices - defied expectations of a 0.2% rise and marked the steepest drop since the early COVID shock in April 2020. The deceleration was not only broad-based but also centered on services, with the 0.7% monthly contraction in final demand services the largest in the history of the index dating back to December 2009 (!).
A major contributor to this service-sector “deflation” was a sharp 1.6% drop in trade margins, implying that wholesalers and retailers are either discounting more aggressively or absorbing margin pressures, due to weakening demand and some strategic responses to rising costs such as tariffs. This margin compression may indicate that firms are finding it increasingly difficult to pass costs downstream, pointing to the same weakness consumers have for months now.
Margin squeezes owing to input costs rising for non-economic reasons tend to produce employment backlashes.
Goods prices, in contrast, were stable overall. The 1.0% drop in food prices and 0.4% decline in energy prices were counterbalanced by modest gains in core goods, such as machinery and equipment. Notably, the price of chicken eggs collapsed by 39.4%, highlighting the volatility in some food components. Core PPI - stripping out food, energy, and trade services - edged down 0.1%, also the first such decline since the early pandemic period, further suggesting that underlying “inflation” pressures are ebbing (as a result of the weakening demand).
The intermediate demand data reinforce this disinflationary trend. Prices for unprocessed goods fell 3.2%, largely due to declining energy prices, including a 4.9% fall in crude petroleum. Processed goods showed mild increases, but services remained flat or mixed across demand stages. Notably, stage 2 intermediate demand - which reflects early production pipeline inputs - fell 0.8%, hinting at continued softening in producer cost pressures that may filter into broader price stabilization ahead.
While annual PPI inflation remains at 2.4%, this print indicates that upstream price momentum is losing steam, and the burden of price increases is being absorbed involuntarily by firms, at least here in the short run, and especially services providers.