A TIC OF FUTURE PRINGLES
EDU DDA Mar. 25, 2026
Summary: Central bankers are going to flood our timelines with increasingly absurd lengths trying to make oil prices into a huge inflation threat that doesn’t exist all the while deflationary condition which absolutely do grow worse. The latter was further confirmed and firmly established by TIC at least through January. The data backed up the behavior Treasury rates as well as our interpretation of systemic offshore conditions throughout the parade of cockroaches. This, not expectations theory, sets the stage for the oil shock.
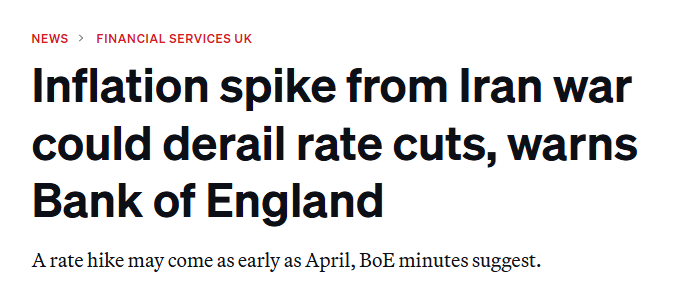

Is the oil shock a bigger problem than the private credit bust? Obviously, we can’t tell the future so that’s not necessarily the right question. Moreover, any answer depends strongly on one’s perspective. We know without question what central bankers will say; they can’t stop talking right now only about the one.
As far as the growing credit crisis is concerned, we do have some idea how the monetary system has been thinking about it. The latest TIC data up to the end of January sheds more light on the state of the eurodollar world before the Iran conflict got going. What it contains is quite helpful when considering how markets evolved through the past few months and therefore what that most likely means for today and tomorrow.
The implications extend beyond strictly global dollar lending. There continues to be a solid correlation between one of our favorite monetary indicators, US bank resales, and US Treasury rates; or, there was prior to January. However, this may account for why yields in February were uniformly falling prior to Iran.
This isn’t to say we aren’t left wondering about a few key matters, starting with still no additional T-bills as collateral coming back for the resales. Curious.
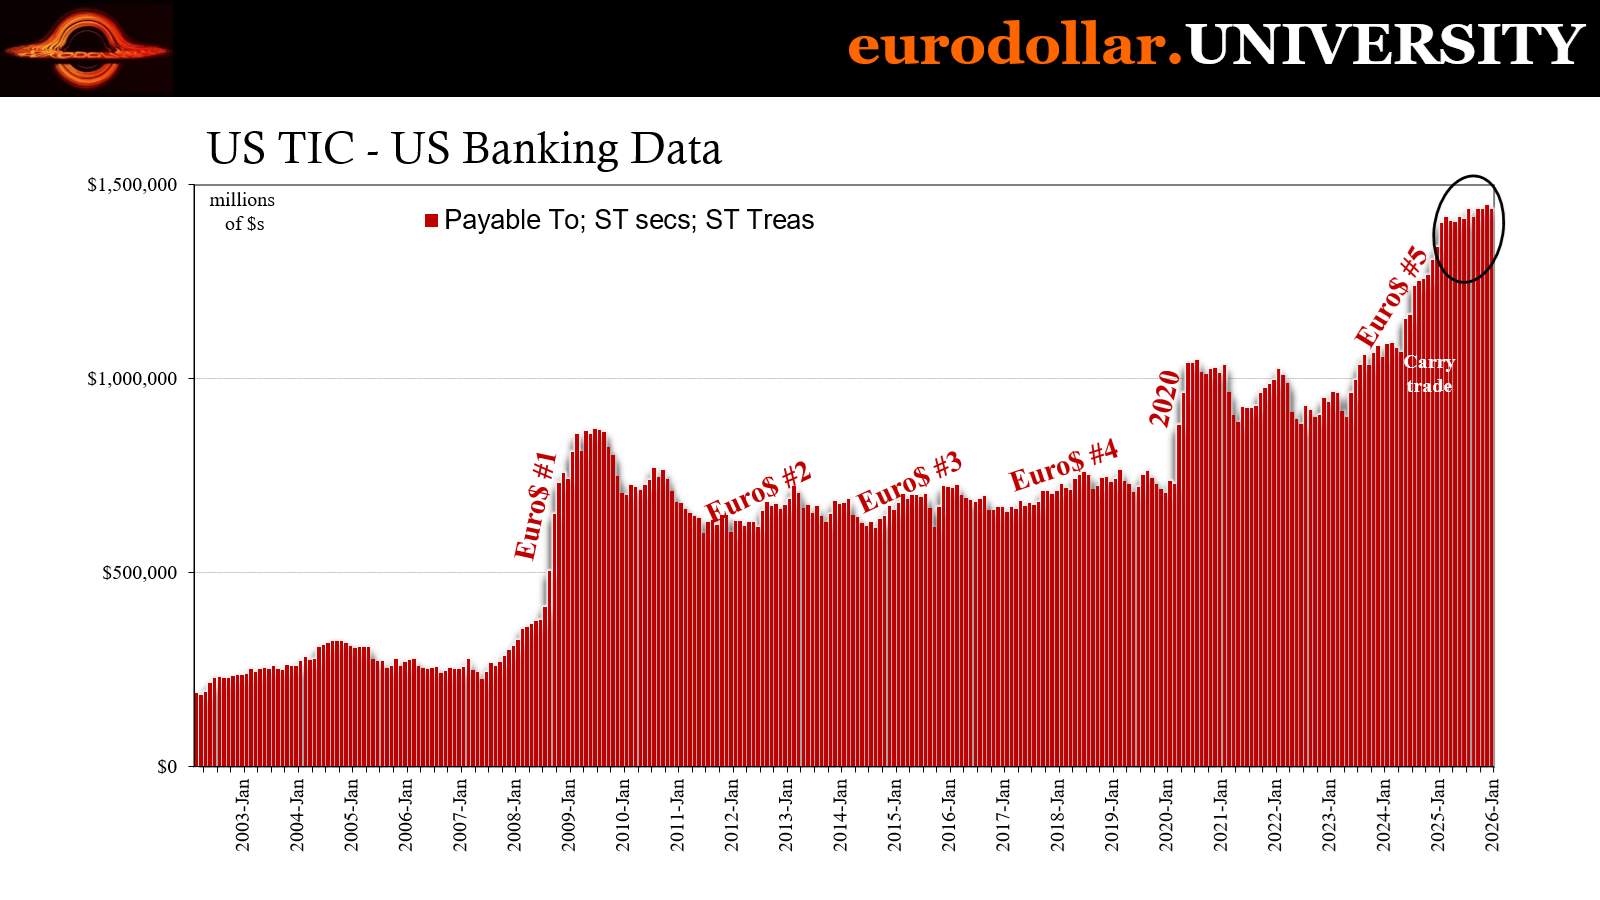
As far as US banks overall, the figures leave little doubt as to their general positioning from even before the start of the cockroach parade. Well before September, TIC’s proxy for it (bank liabilities vis-à-vis foreigners) has been steadily declining. Q4 was the largest setback in reported liabilities since 2023’s banking crisis.
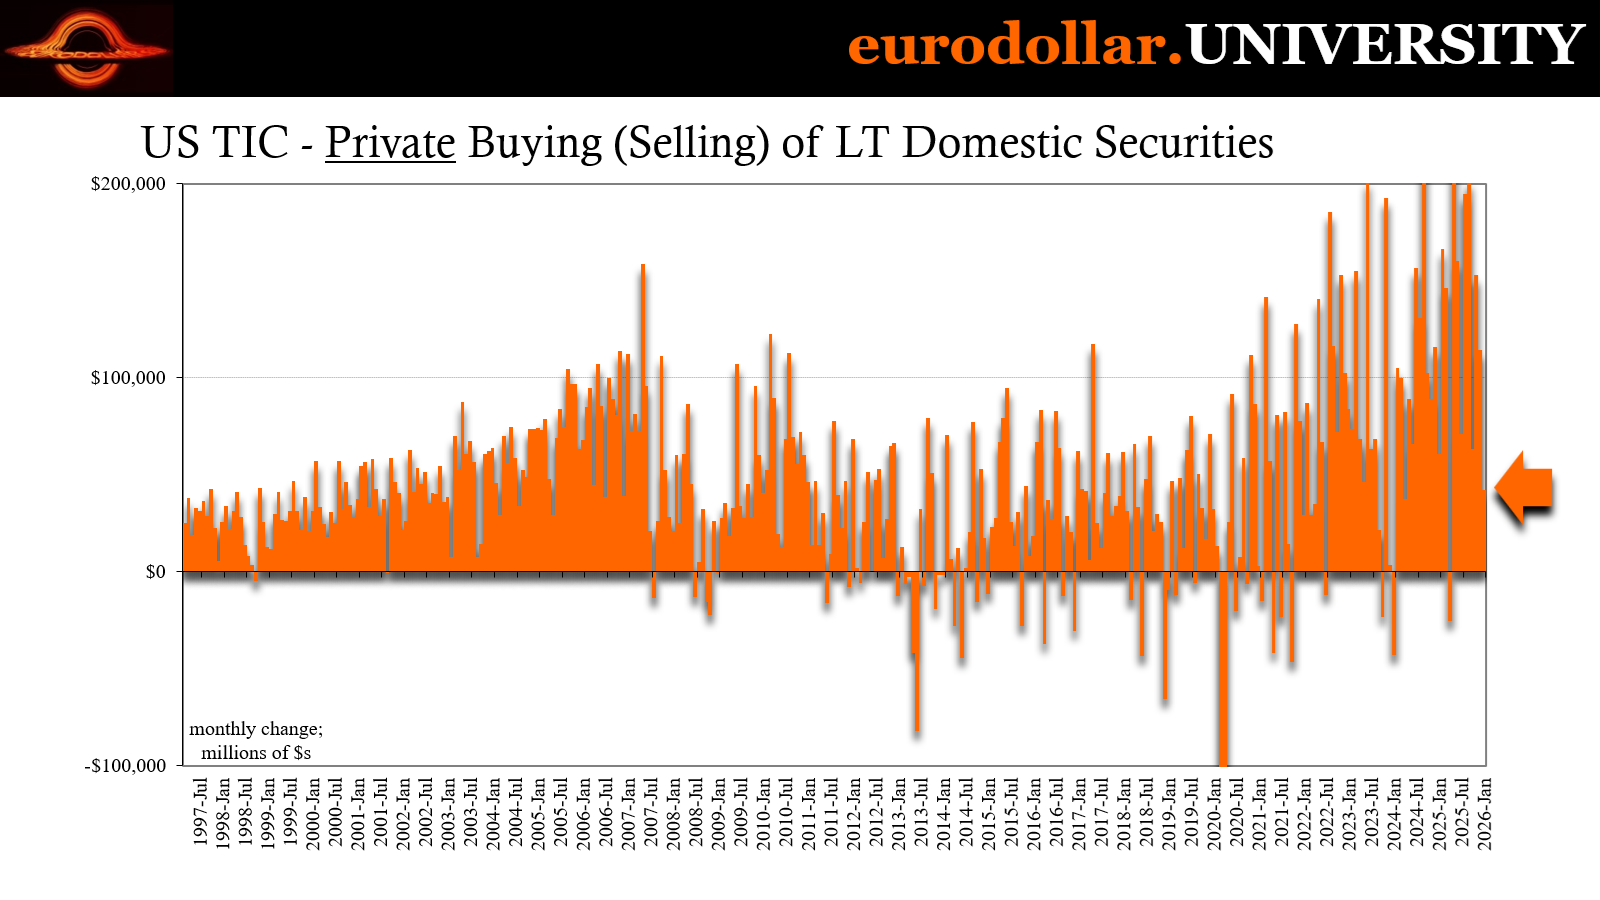
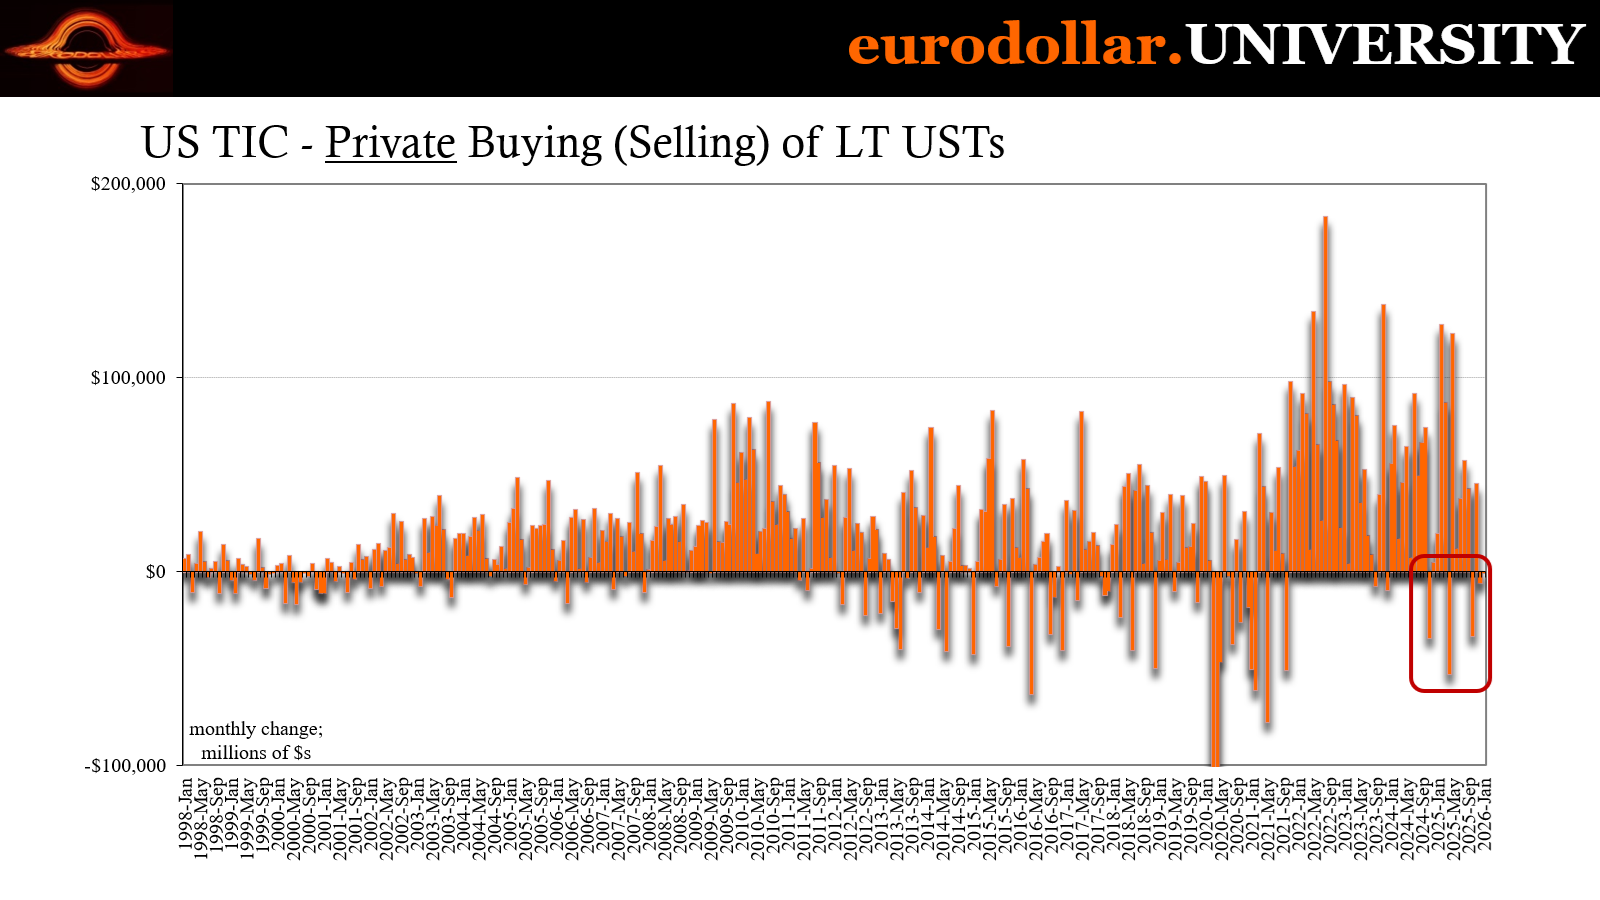
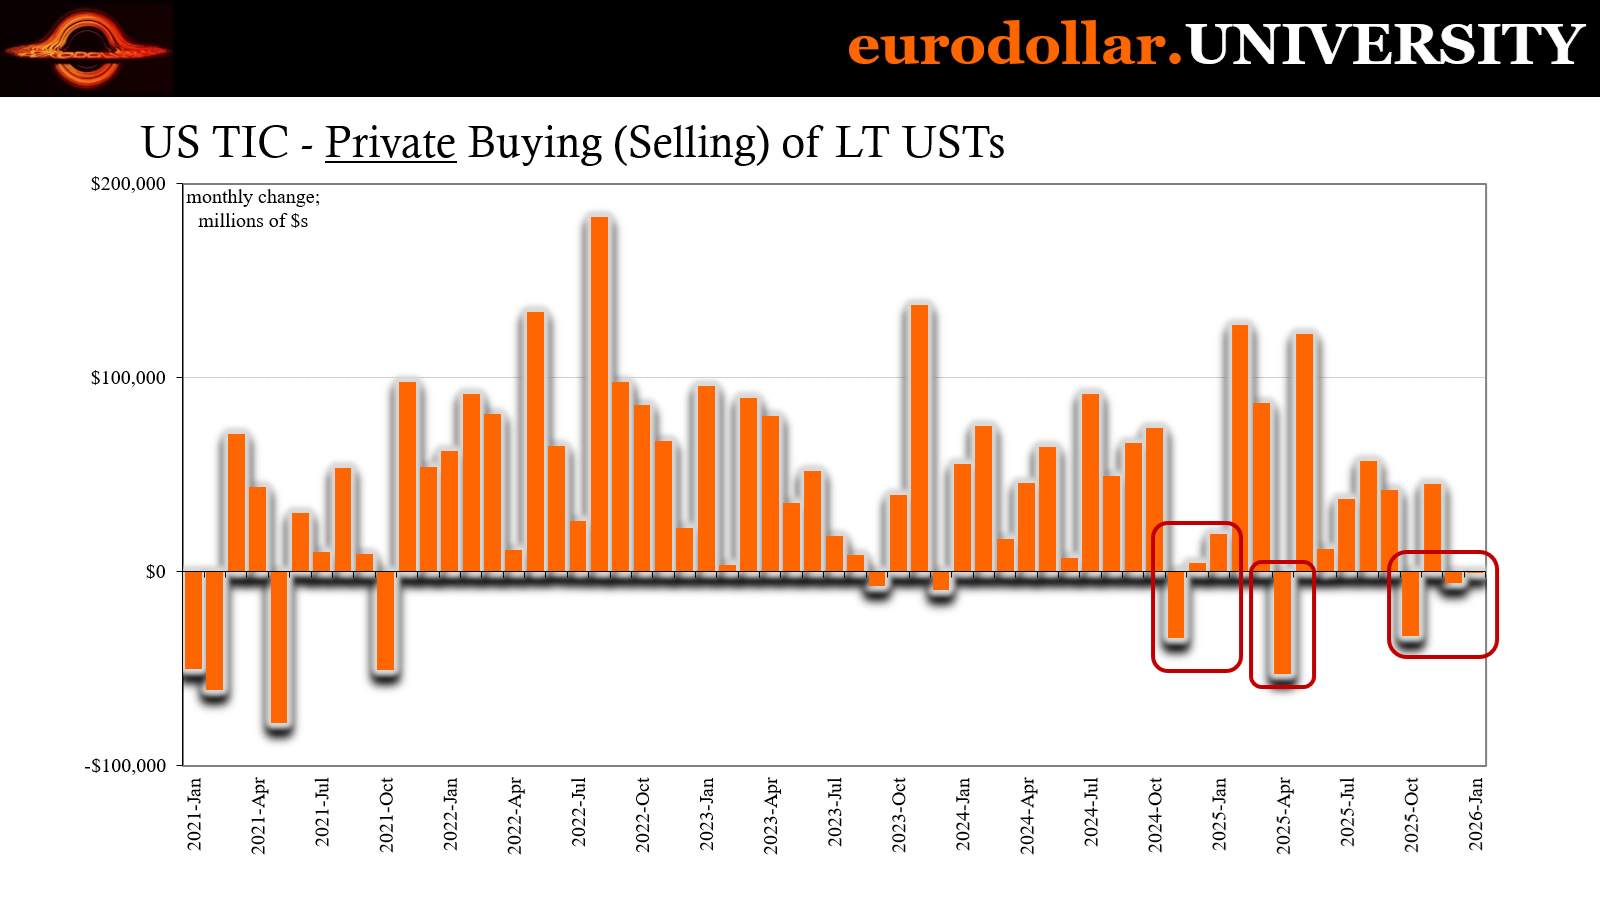
With that background, unsurprisingly private foreigners on the other side of that dollar shortage haven’t been able to buy many additional reserve assets. In fact, in three of the past four months (October, December and January), there were net sales, a highly unusual occurrence though one entirely consistent with everything mentioned here (and a good deal already discussed previously).
As far as global banks are concerned, they were increasingly concerned about something before Iran. The credit bust is a good guess along with how the overall economy was “unexpectedly” tailing off after last summer’s artificial high had fooled central bankers and Economists into thinking the only problems facing the world had been trade wars.
See what I mean
This is one of those dead-horse topics which deserves its everyday beatings. From here on, we’re going to be subjected to insane levels of dogmatic adherence. Superstition is one thing, for Economists their slavish devotion to expectations theory truly is next level.
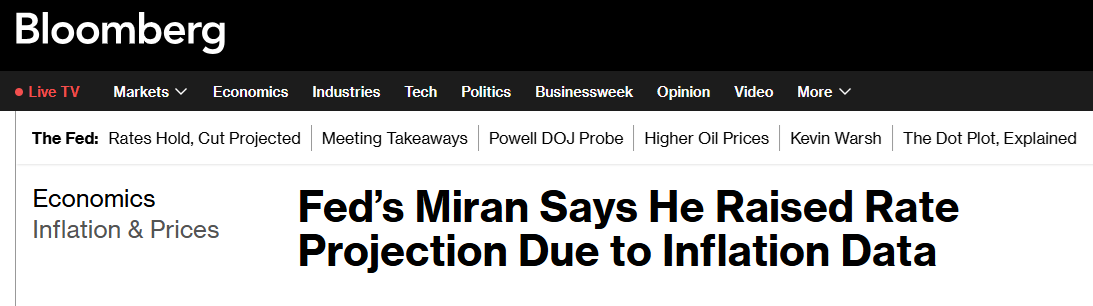
I could choose any number of examples just from the past few days. Today, noted Federal Reserve ultra-dove Stephen Miran, the same guy who has consistently dissented against anything other than a 50-bps rate cut, the guy comes out stating he’s had to significantly revise his view on ST interest rates. And it wasn’t even due to the energy shock:
I boosted my policy rate by half a percent, not due to oil and Iran, but due to the inflation data that we received.
Sure, bro.
NOT WHAT HE SAID IN OCTOBER (BELOW)
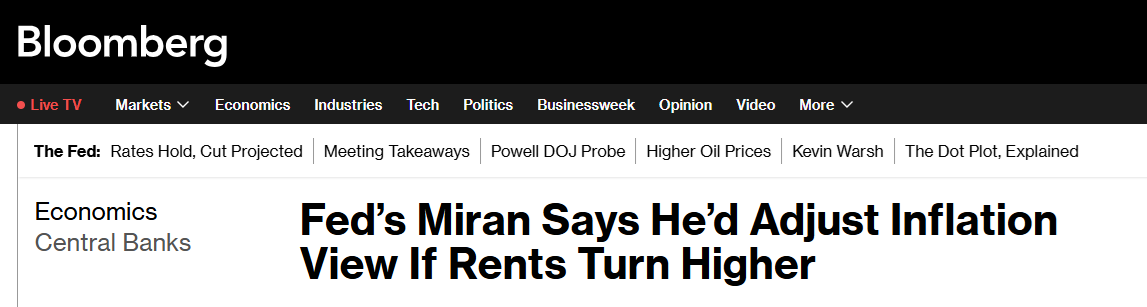
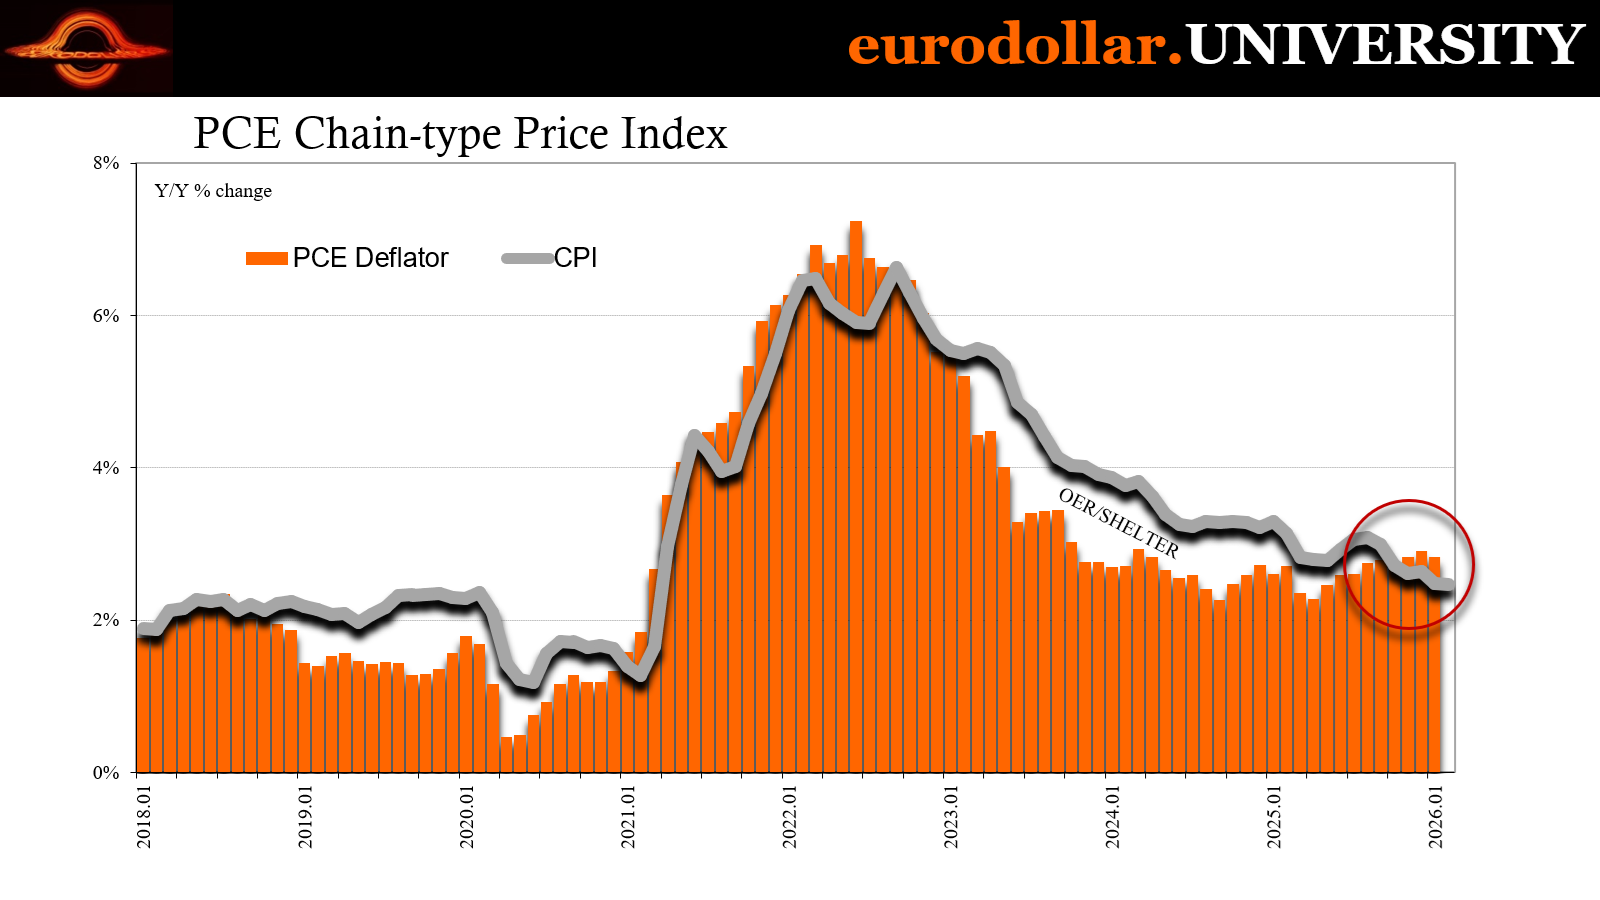
Miran’s referencing the PCE deflator figures which continue to run ahead of the CPI owing largely to differences in basket construction and how much shelter prices affect each one. With the imputation in the CPI finally coming down after too many years overstating price effects – which Miran himself pointed to not all that long ago – it has had the effect of reversing the relative position of the two measures.
Previously here in the 2020s, the CPI had been noticeably more inflation-y thanks to OER (owners’ equivalent rent quackery). Now that it’s finally reverting to where it belongs and beginning to undo the illusion of the past too many years, Miran’s hanging on the deflator?
Let’s be honest, Mr. Dove can’t say his position has been changed by oil prices when we all can see that it was.
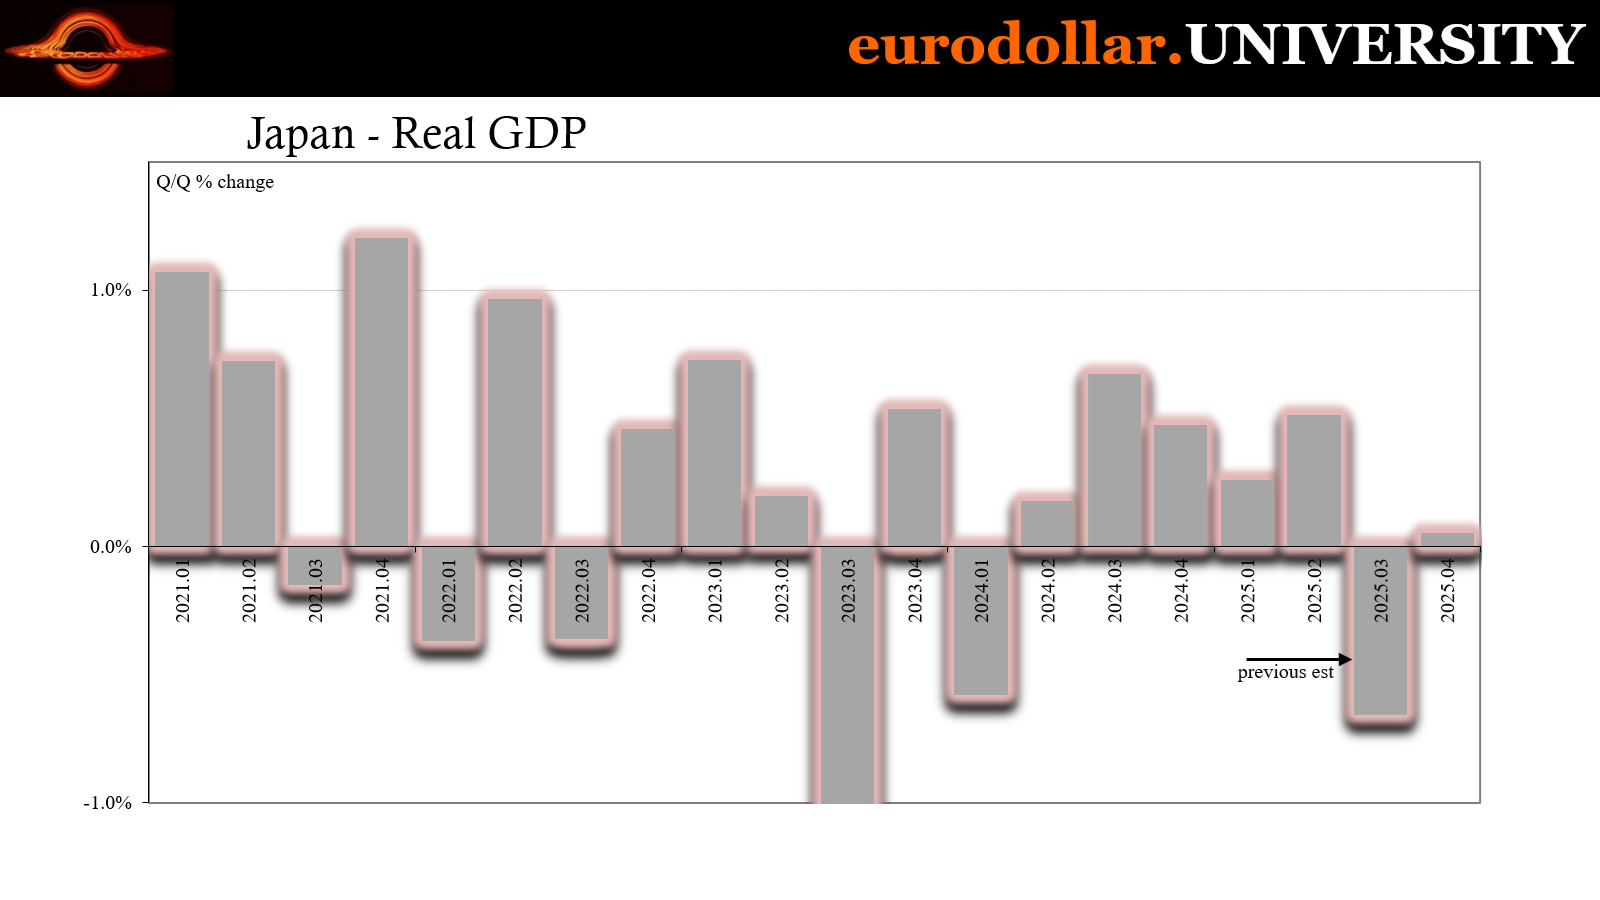
That wasn’t even the most egregious example of the past 24 hours. A far worse demonstration was put up by the Bank of Japan. First of all, policymakers there have already said they’ll choose to hike rates even if the economy remains weak. As we know, Japan is effectively (meaning unofficially) in recession to begin with or at least had been over the second half of last year.
Ueda couldn’t care less. He’s had this inflation story to propel official policy long before Murban almost touched $150 on Friday. But then earlier today, the Japanese government reported “unexpectedly” soft CPI numbers. While they were immediately attributed to government utility subsidies, food (rice) was equally as responsible and the far more relevant explanation.
It was the 2023 heat wave’s effect on rice crops which ended up being responsible for most of the “inflation” the past few years. Now that harvests are coming back, that supply shock is fading even if government policy did take a few bps off the CPI rates in January. Look no further than the CPI excluding food and energy – it’s been consistently under the BoJ target for several years.
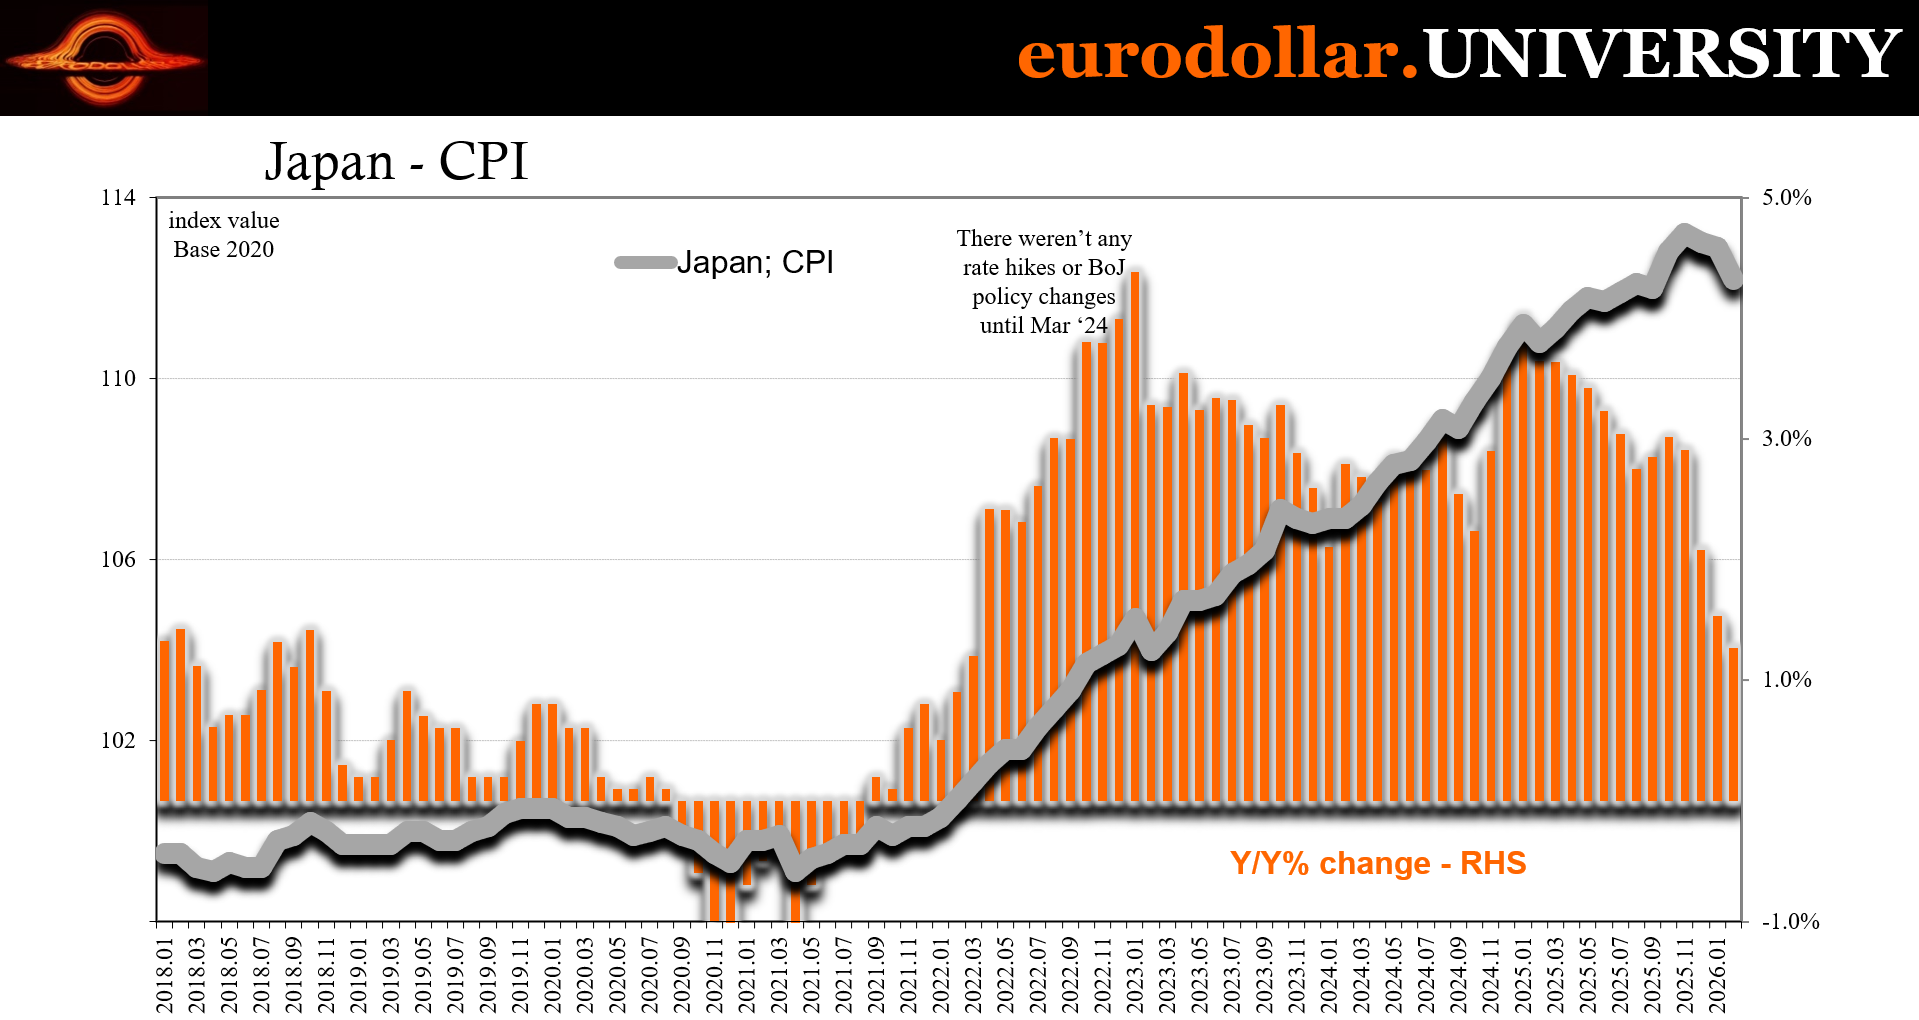
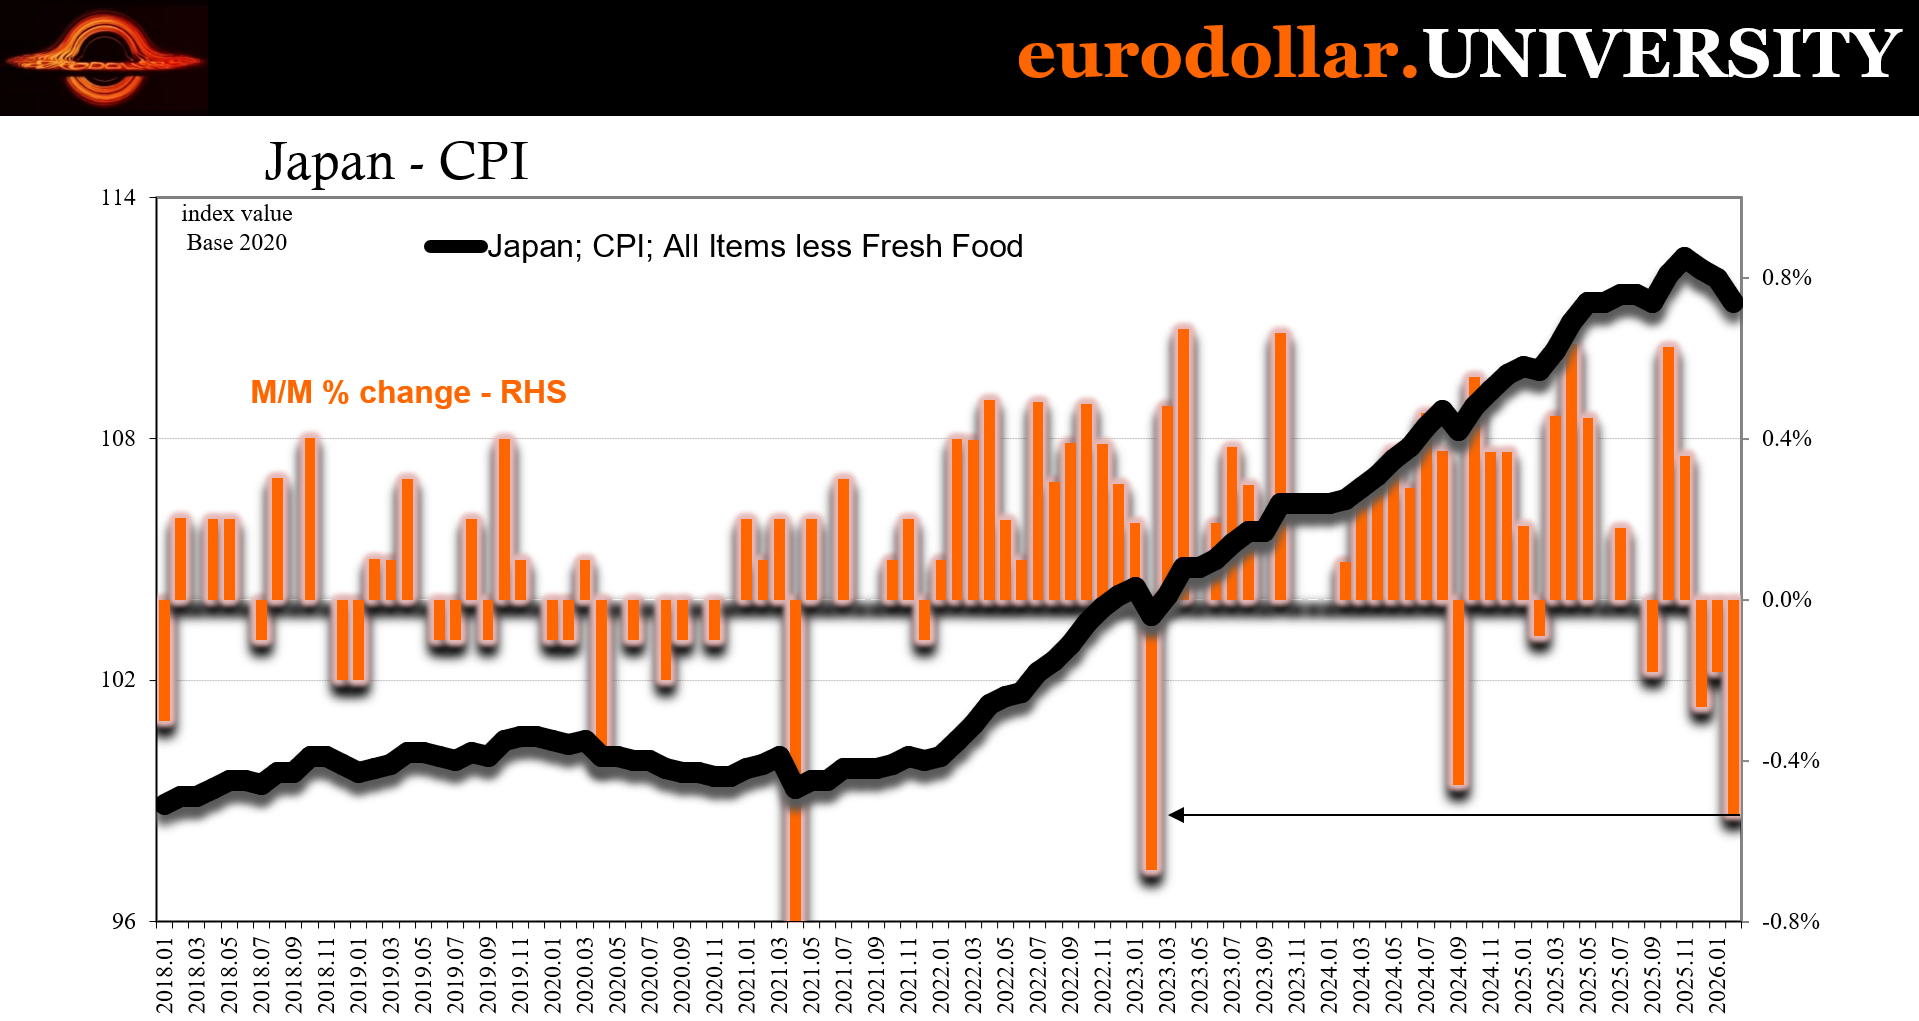

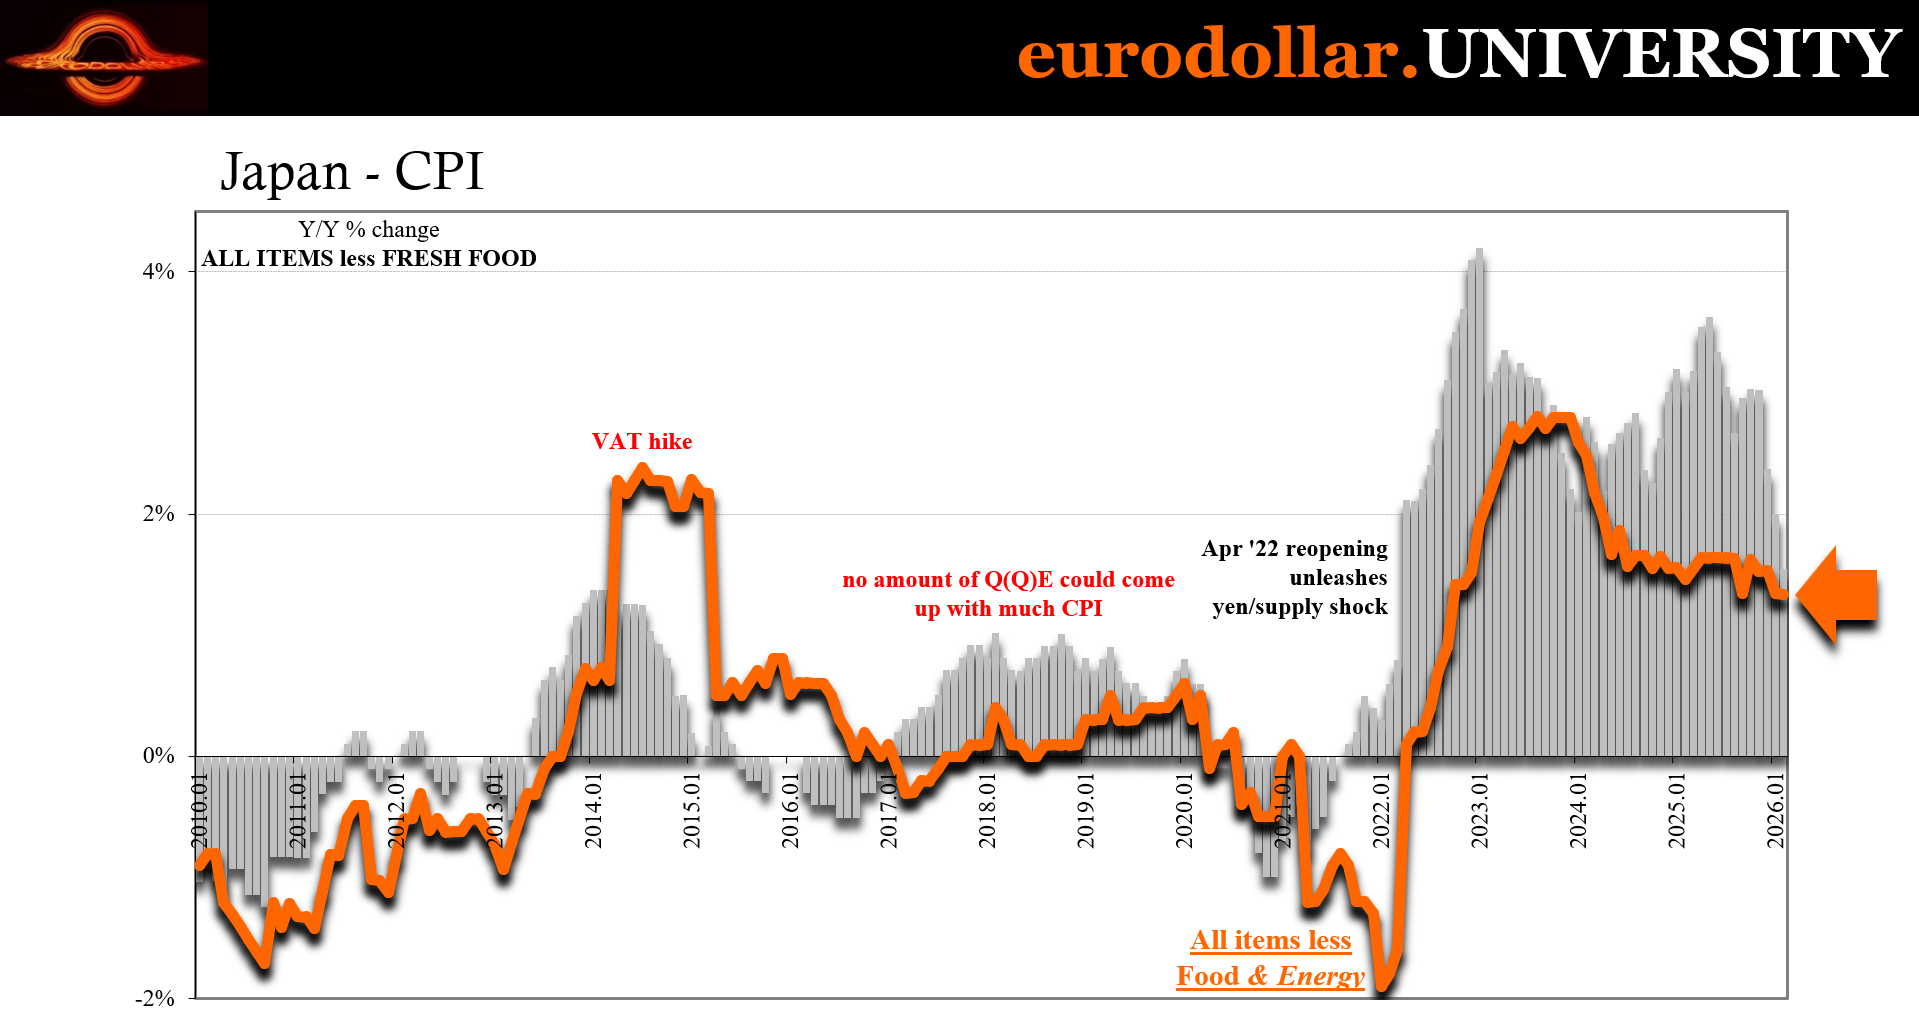
And it weakened yet again even if utility prices don’t affect the index.
Unnamed BoJ officials responded to the erstwhile good news by, once again, focusing entirely on oil prices. Not the recession nor badly struggling households. The CPI to them was already old news. Nope. It’s all petroleum from here on until either the economy collapses or crude does (usually the two in tandem).
There will be much more of this until then.
Banks really were TICked
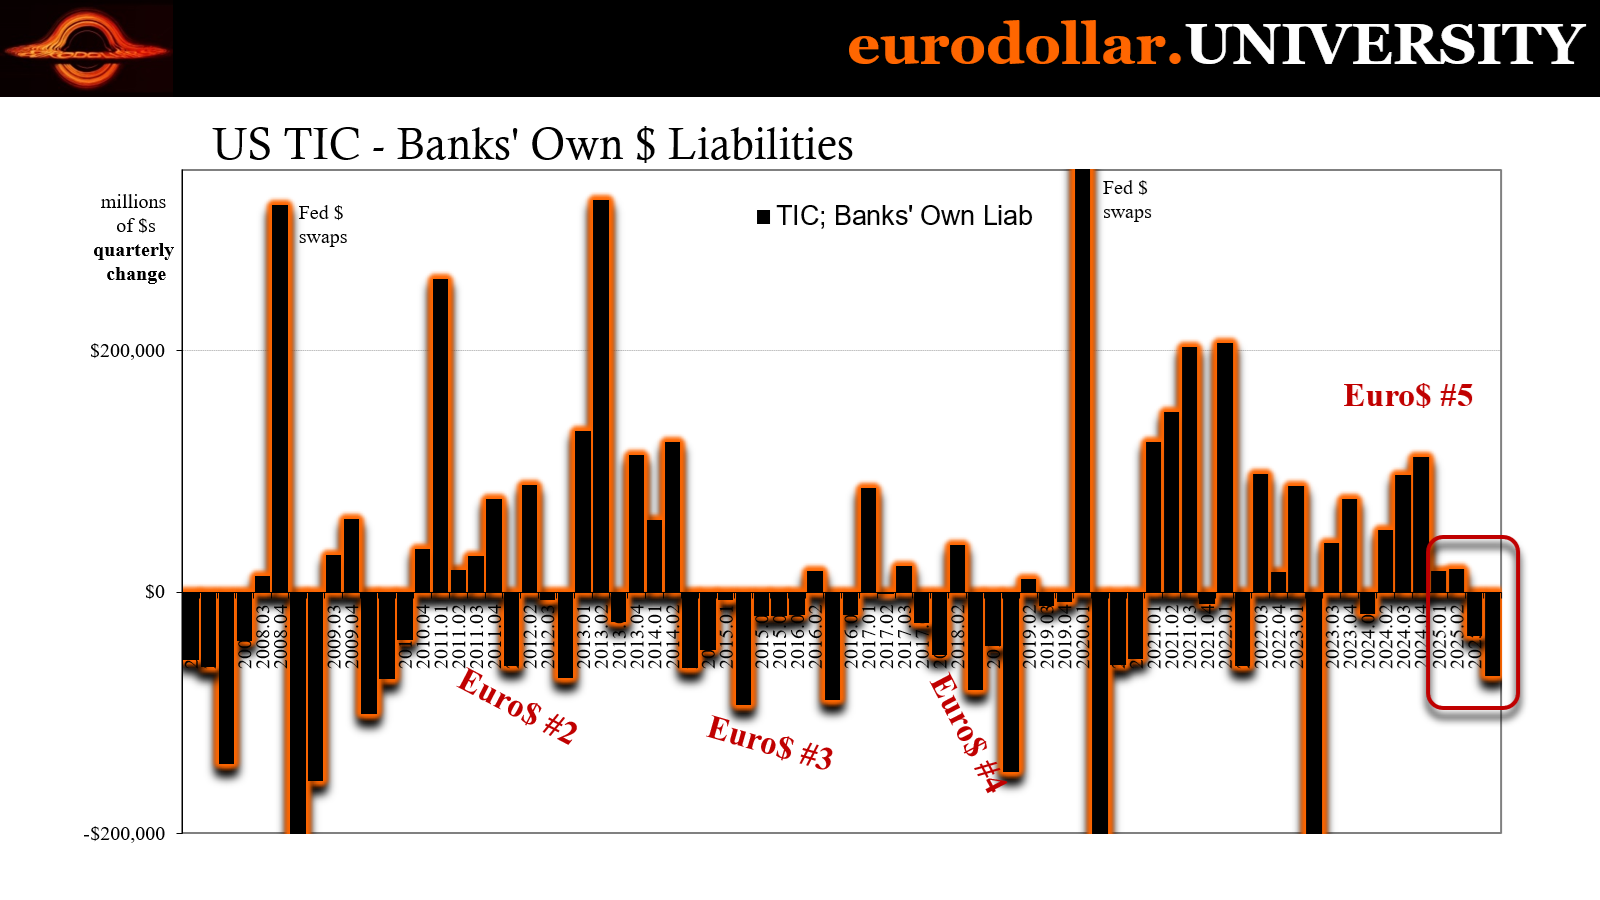
Given the limitations of the data owing to the shadowy, black hole-ish nature of eurodollar itself, we always have to keep in mind what the figures give us is nothing more than a rough proxy of whatever conditions we’re hoping to examine. That’s especially true for the first series on our list, what’s titled “in Banks’ Own Dollar Denominated Liabilities”, or basically an overview of their balance sheet resources dedicated to foreign dollar activities.
This is also a particularly noisy datapoint, too, having mysteriously attained a noticeable seasonality around 2014 only to lose it more recently (goes with the territory of trying to peer into the monetary abyss using statistics which weren’t even designed for this). To gain any signal from out of that noise we’ve got to use either changes in quarterly totals or rolling 6-month accumulations.
However, when you do smooth out some of that variation, good information often spills out. Since the data is two months in arrears already, at best we’re getting confirmation of what might have already happened; valuable nonetheless.
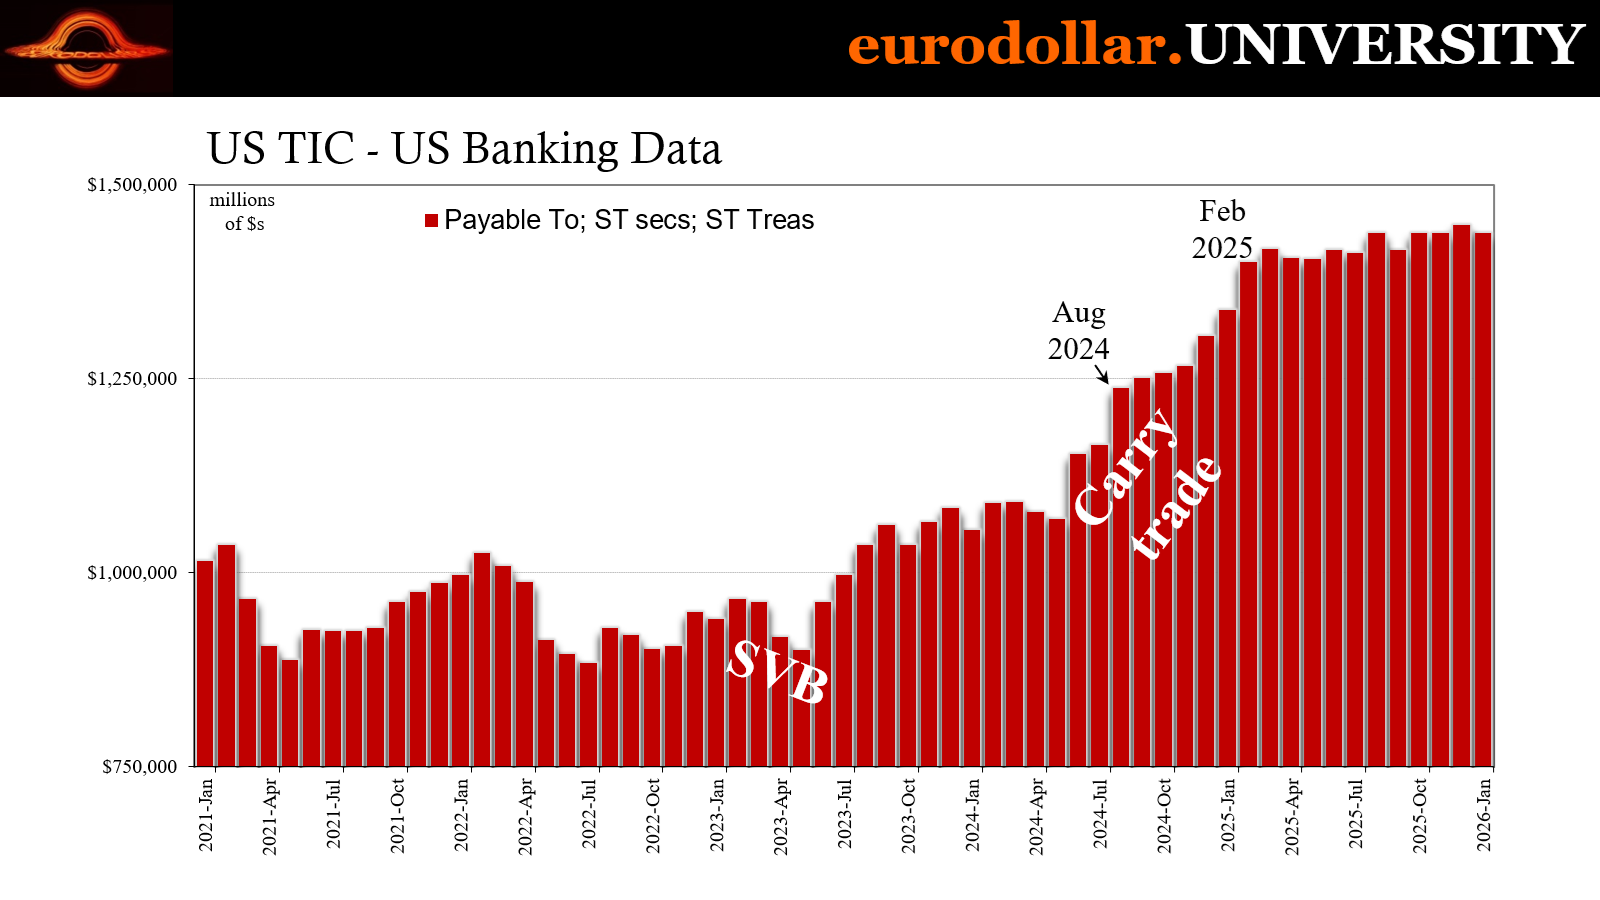
In our current case, bank liabilities had been weak and negative the entirety of 2025. From the quarterly totals, it began with Q1 coming down off Q4 2024’s artificial high with much-reduced increases during the chaos of that period (“tariff uncertainty”). But the pullback in liabilities really began after then with Q3 before a much greater and more significant decline for the cockroach-riddled fourth quarter, which ended up being the biggest setback since the bank crisis in Q2 (mostly) 2023.
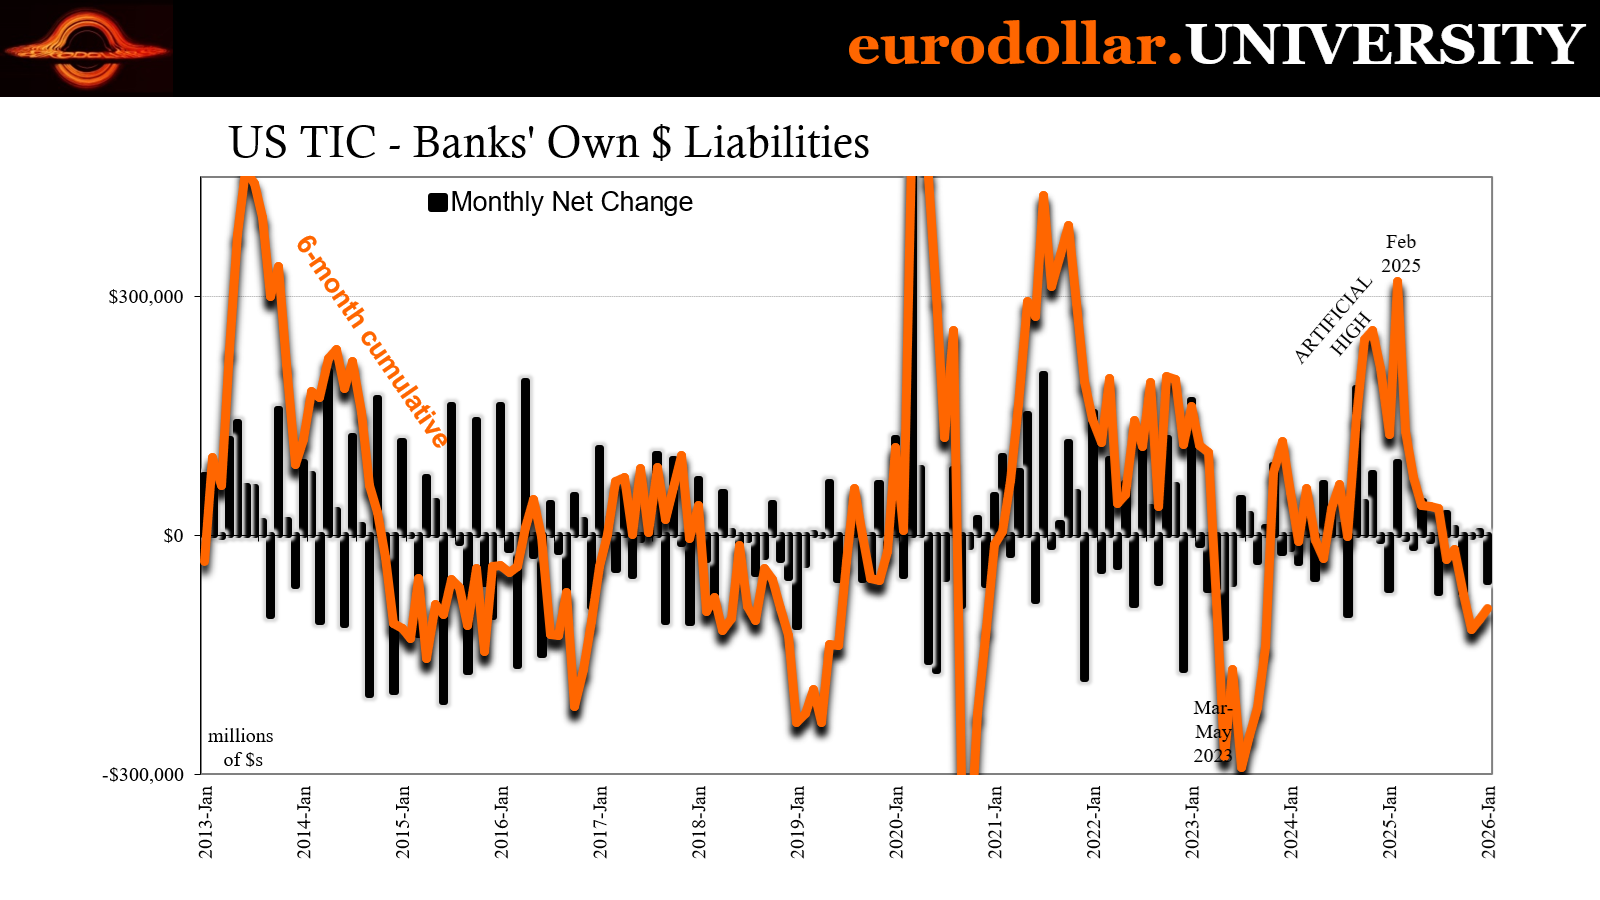
Using the 6-month rolling totals, we gain a little more clarity on timing. This one puts the artificial peak in activity (dollars and real economy) last February before beginning to fall apart with risk markets in March 2025. It’s been all downhill since then, even before private credit flipped from bubble to bust, largely from worries over the always-there flat Beveridge, forgot-how-to-grow background (which is now clearly visible thanks to the QCEW).
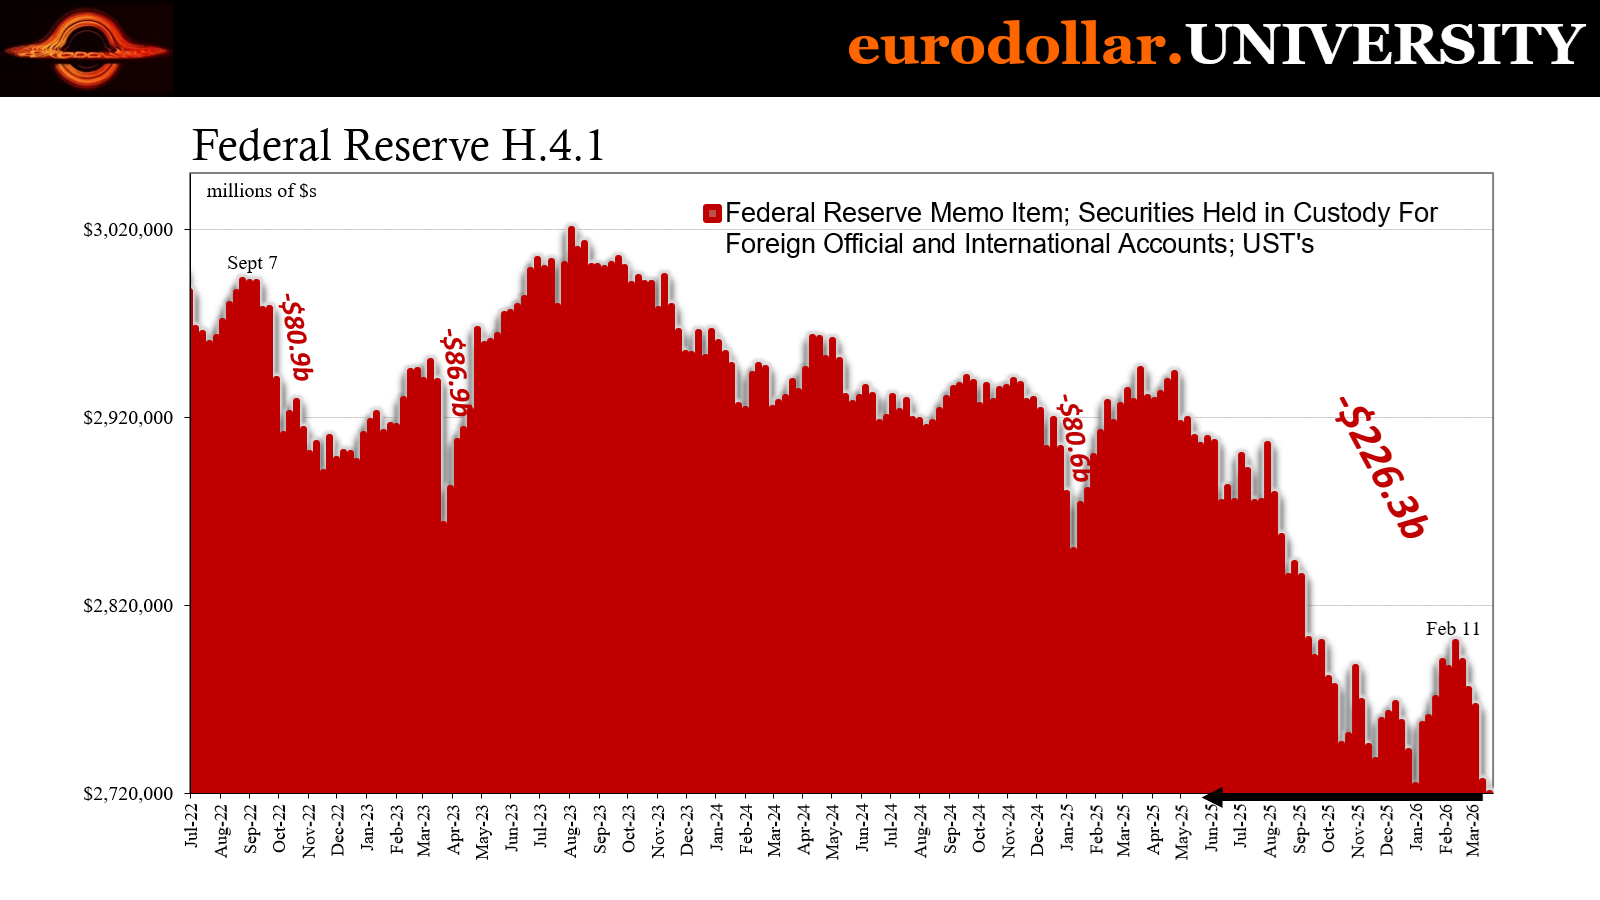
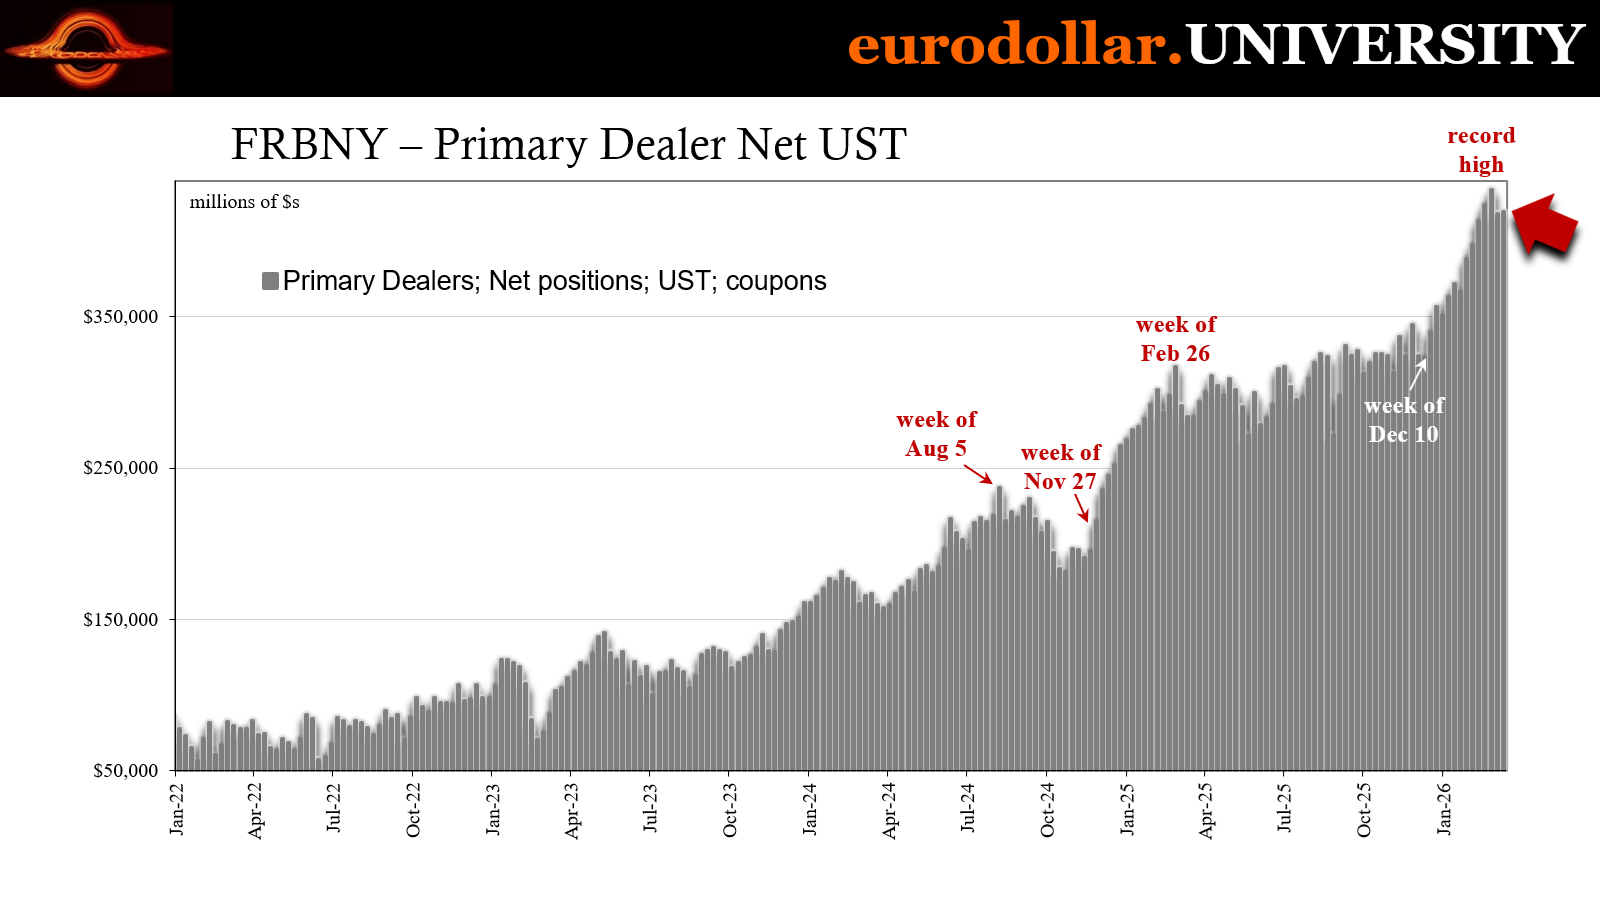
With the arrival of negative payrolls then the credit market shift, US banks, anyway, have been pulling back more aggressively. That fits with basically all the other sources like FRBNY’s UST custody data which has consistently if indirectly pointed to a sizable dollar funding hole as hundreds of billions of those reserve assets disappeared.
If US banks were indeed becoming this restrictive in balance sheet capacity, we could reasonably infer foreign banks (and offshore subs of US banks) were probably doing something similar adding to the picture of a worsening eurodollar shape; with Jamie Dimon helpfully providing the narration for it, if in his own quippy way.
Not to mention the bluest of owls and all the related events we’ve been cataloging.
Unlike the generally calmer tone observed in repo, for example, during January which was unsurprisingly attributed to the Fed’s not-QE, according to the TIC data there was no real break in the downside – matching FRBNY’s primary dealer survey showing how US dealers kept on building up their collateral holdings throughout that month. This suggests, as I already had in various places, January’s boring repo was more about the calendar than any other factor (including bank reserves).
While maybe calm on the surface, the system continued to expect and prep for more to come.
Reselling resales without bills
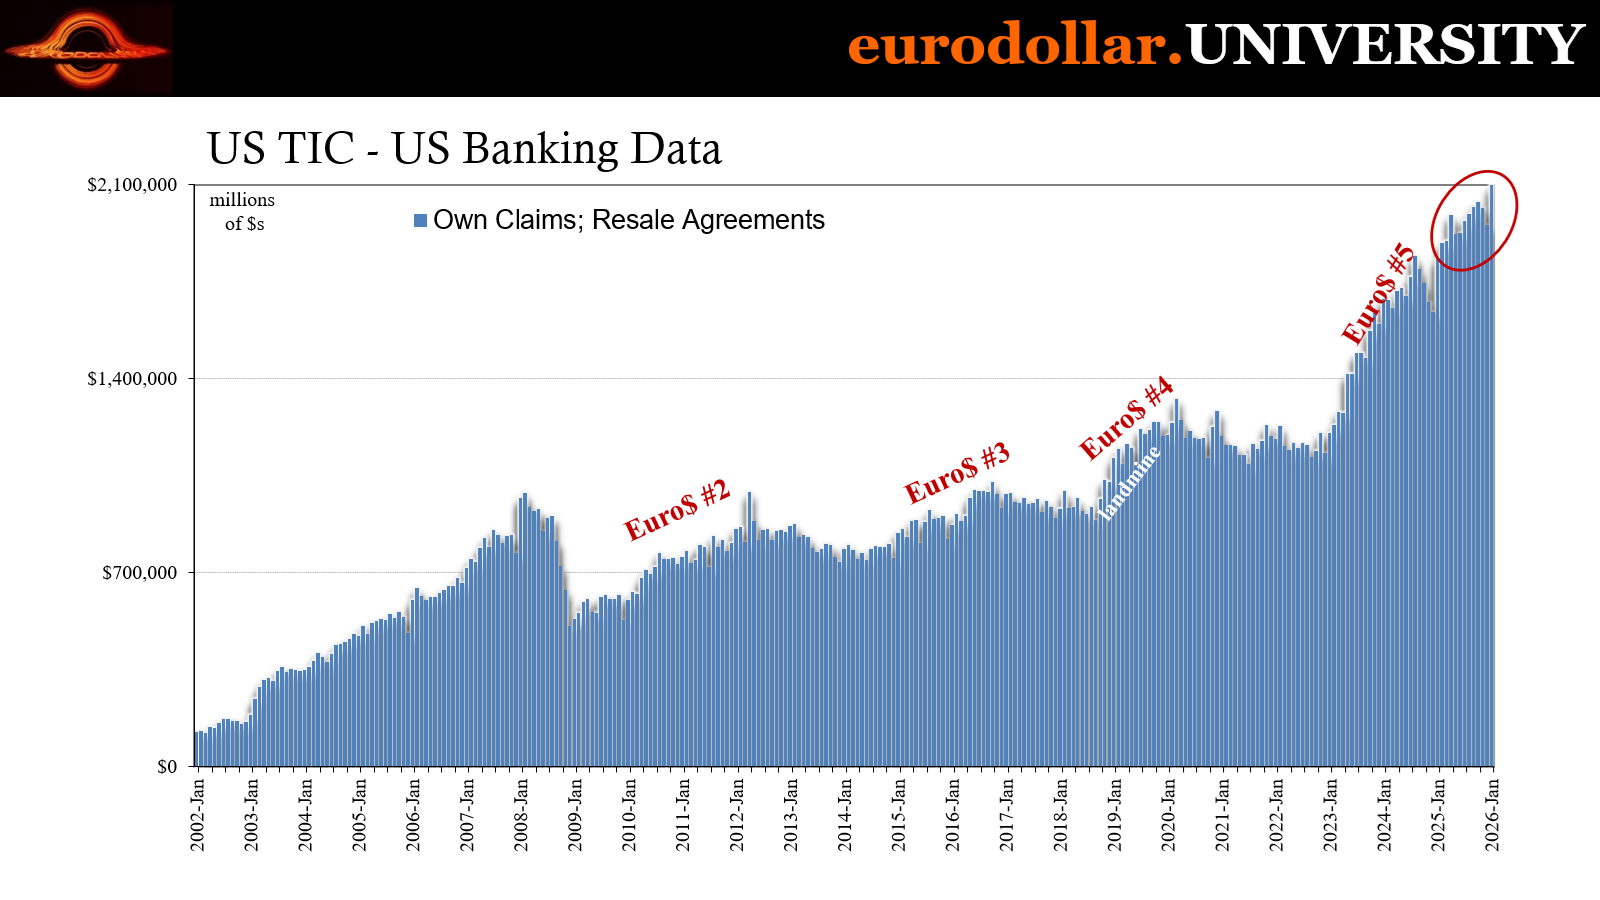
For quick review, resales are TIC’s way of describing repo lending by US banks to dollar borrowers outside the US. A repurchase is the same transaction from the perspective of that borrower, therefore the lender conducts a reverse repo or a resale. There really is no need for separate terminology, but I didn’t make the rules (different conventions sprung up independently).
During the Silent Depression era post-2008 crisis, rising resales indicate funding stress offshore. The repo system (and FX, by proxy) is the true lender of last resort in the eurodollar world, not the Fed. Thus, an increase in US lending on a collateralized basis (the resale) more often than not points to serious and growing monetary problems, especially when corroborated by the rest of TIC and all the other figures beyond.
Resale volumes kept rising throughout last summer (flat Beveridge) culminating with October’s cockroaches, thus monetary tightening which offshore borrowers were handling by appealing to US dealers who were willing to lend even under strain. Volumes came back down to an extent in November and December, which may be somewhat contrary to our interpretation of circumstances in those months.
It may not end up having mattered since resales surged all over again in January.
It is entirely possible the problem – such that there might be one – is how monthly data by its nature can’t discriminate shorter run changes. We know that there was a hell of a mess in the first half of December but which calmed down by the end of the year. Since the figures are month-end reported rather than monthly averages, it could be that TIC captured only the latter relaxation.
And then reversed everything in January; what might have started out appearing to be relatively placid didn’t end up that way. According to the resale numbers, volumes were up sharply for the month, though, again, we don’t know when during it that might have happened.
What we do know, or have good reason to suspect, is that the collateral coming back from those resales continues to be other classes of financial instruments beside Treasury bills. This is curious; normally during periods of visible strain like the months in question dealers demand top quality security. You’ll normally find the concurrent rise in T-bill liabilities (in a resale the cash lender has the obligation to return the collateral, thus it gets booked as a liability here) alongside resale volumes.
Going back to last year’s deflationary mess, by contrast, there hasn’t been any increase in bills being offered which either means the data isn’t picking up where those might be coming from or US bank lenders aren’t being as picky as they normally would. I doubt, too, that’s because those lenders have suddenly grown more positive about the state of everything.
It’s a tenuous nod to collateral difficulties, something I’ve pointed out before using the same data. Thus, whatever it is, the oddity continued straight into January.
A temporary split from yields
TIC provides another, even stronger and more visible correlation out of resales. Going back again to the post-2008 eurodollar environment, when US banks are forced into their last resort role as cash lender in repo, UST yields are generally if not quite always moving lower as that happens.
This relationship makes sense straight away for fundamental reasons that will never once show up in any mainstream commentary. From heightened collateral pressure therefore demand for USTs as collateral to just generic demand for safety and liquidity, not to mention lower growth and inflation expectations. After all, if US banks are effectively “bailing out” eurodollar borrowers out there in the offshore world to any significant extent, it’s a good bet the Treasury market is more than aware of it and pricing everything accordingly.
While this isn’t a one-to-one, more of a loose relationship, it has held through several different regimes and cycles, including reflationary periods.
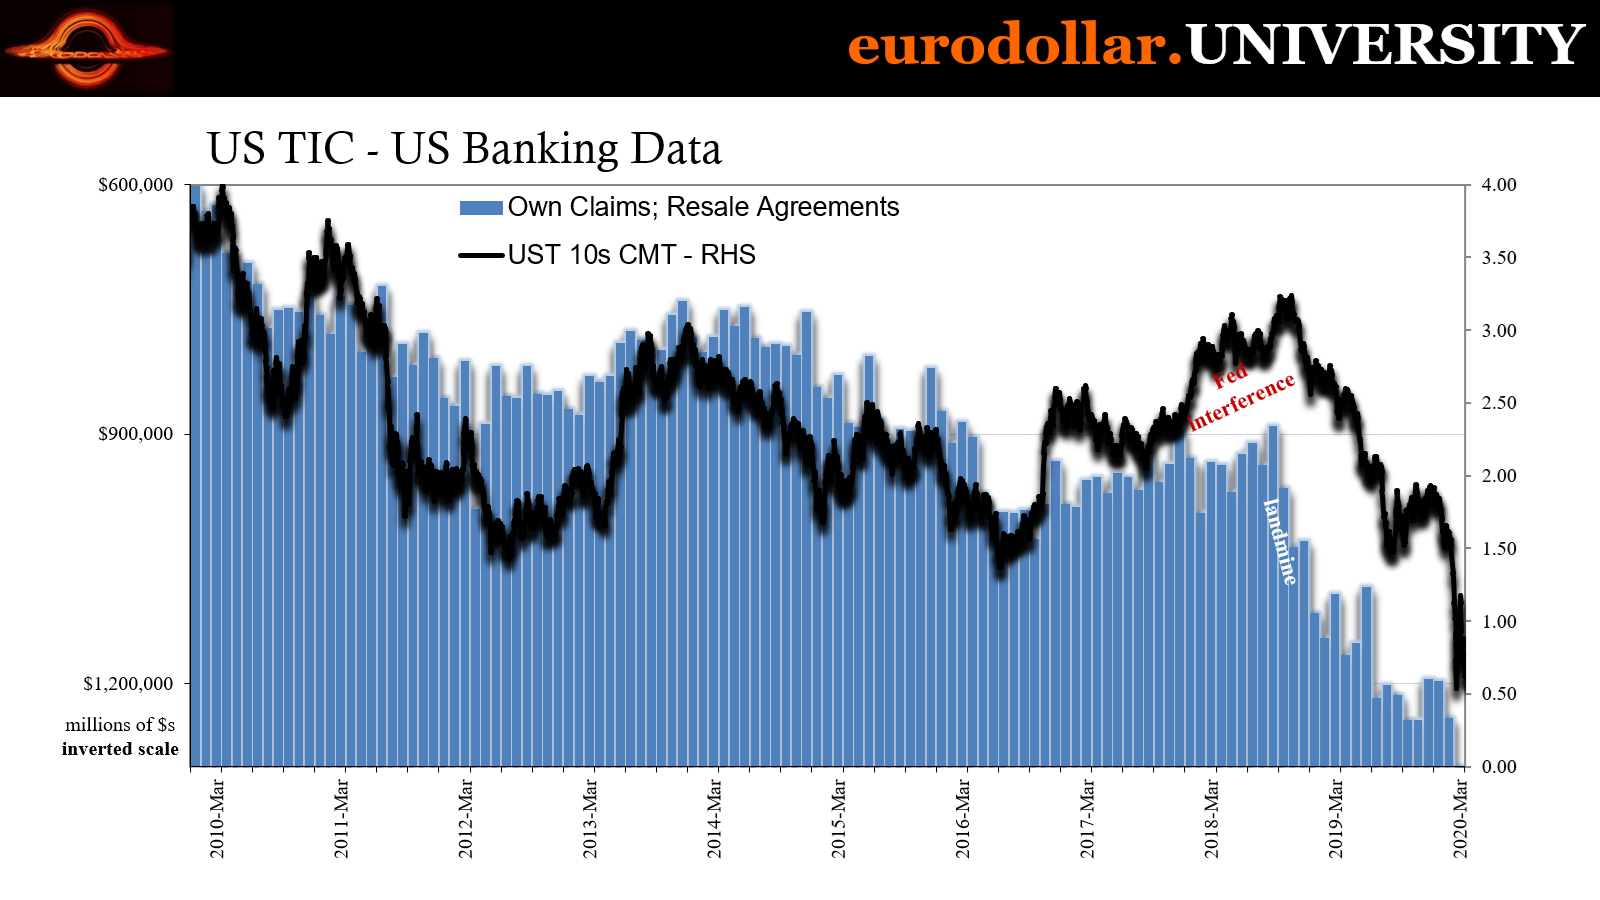
You can also see it very clearly over the past year and a half. During the artificial high during the final few months of 2024, resale volumes declined at the same time Treasury yields (across the curve) backed up significantly.
That reversed course in resales in January 2025 (TIC’s bank liabilities didn’t show it until the following month, as previously stated). UST yields unsurprisingly peaked in that same month (while everyone was convinced the prior rise in rates must have been due to Treasury rejection or fears over restarted inflation). The coming deflation had resale activity jumping over the next several months at the same time UST rates were “unexpectedly” dropping.
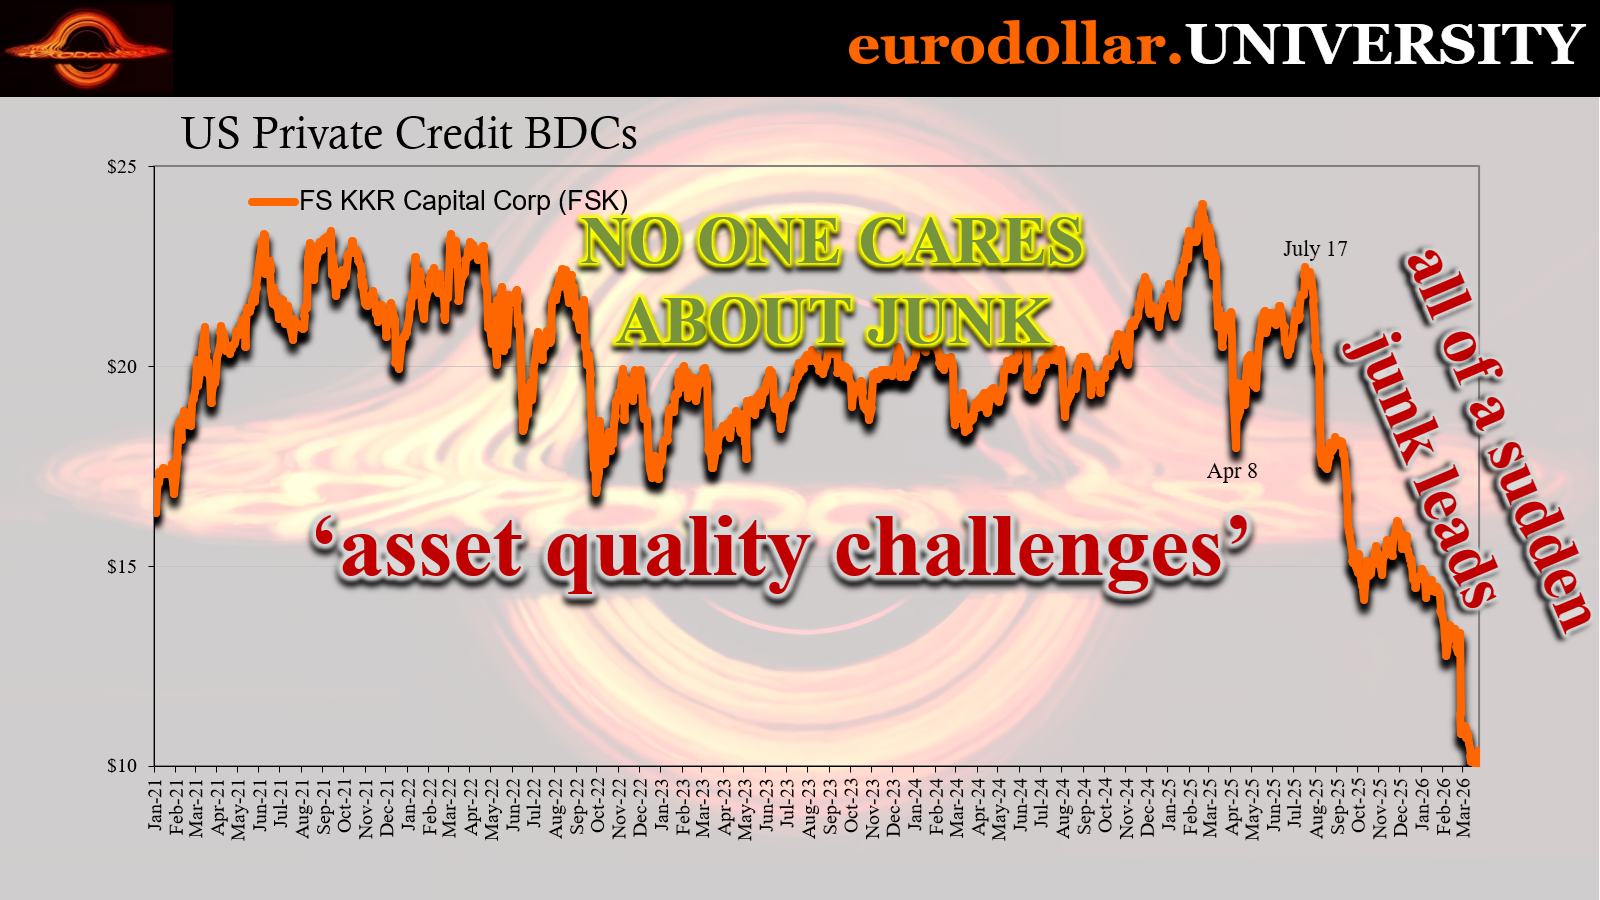
There was only a small reversal in each during May and June before the tightening and downward bias in rates returned in July. And we see this same pivot all over the financial map, too, including basically everywhere that has anything to do with private credit – look at Blue Owl’s stock or, as pointed out yesterday, the KKR fund which was just downgraded.
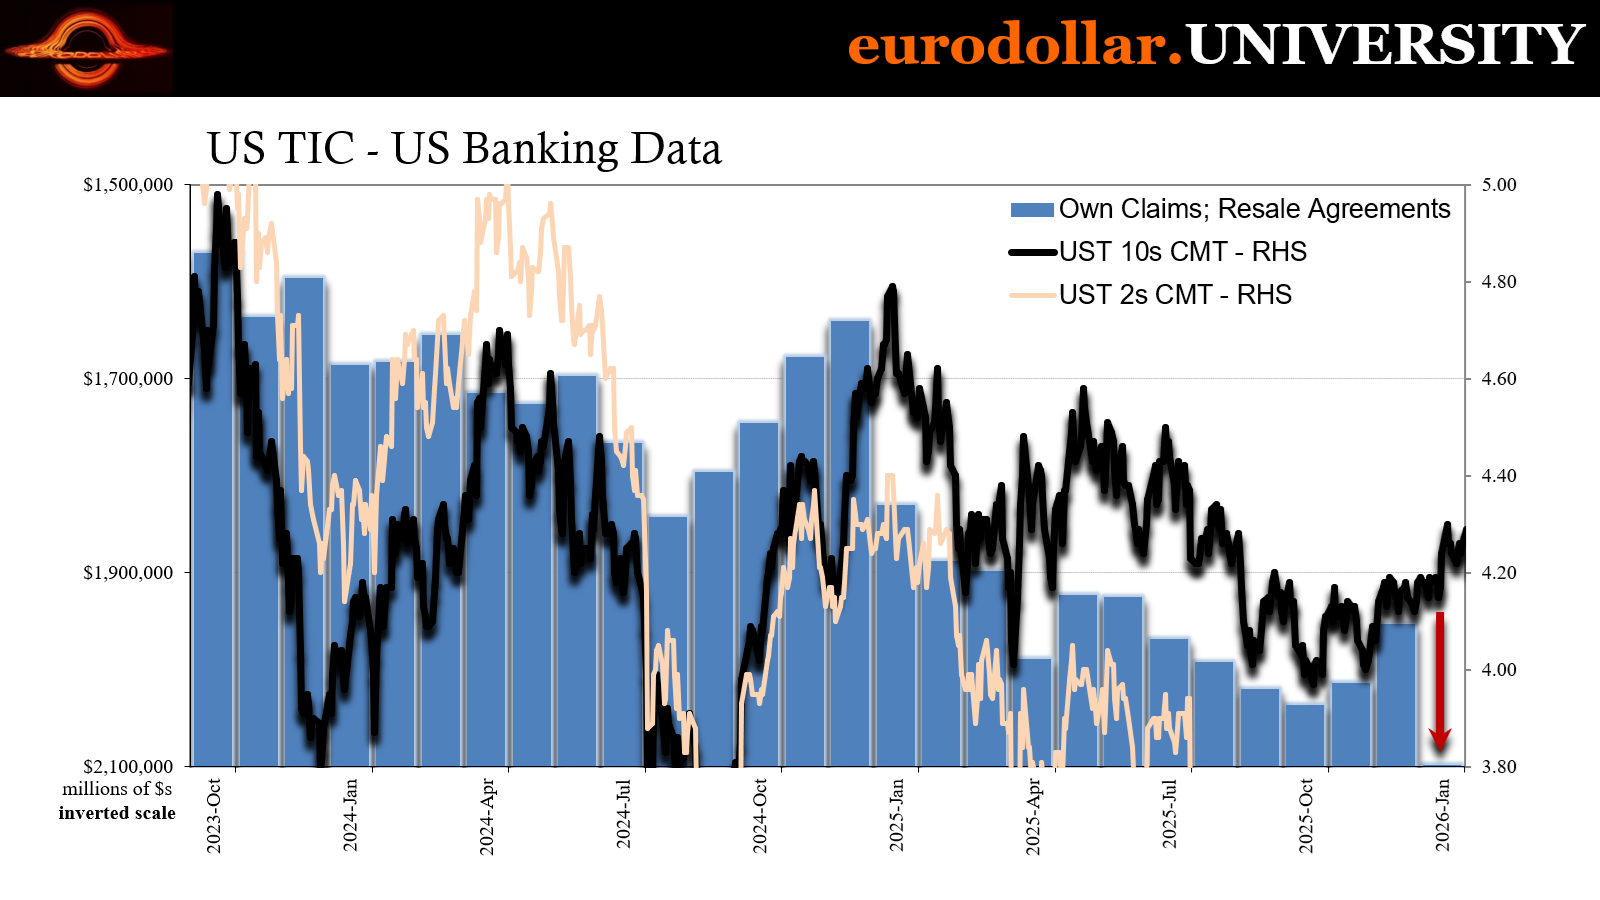
Over the next few summer months, while “sell America” was enjoying its 15 minutes and central bankers turned positive after falling for the next artificial distortion believing it was indicating a recovery after “tariff uncertainty” had failed to crash the entire world, banks and borrowers were seeing and experiencing very different views and conditions. Resales rose again just as UST yields were “shockingly” falling despite the constant narrative of “tariff inflation.”
No, real deflation.
That wave then culminated, as stated in the previous section, with the events of October before both resales and Treasury rates reversed slightly over the next two months – or parts of them.
However, while resales boomed (not good) in January 2026, market rates did diverge. Again, that might have been a matter of timing and not having an accurate, granular picture of exactly when these things are happening on shorter timescales. These are also far from perfect and direct relationships, to where tightening in global repo (and presumably FX) does not immediately and proportionally get priced onto the yield curve.
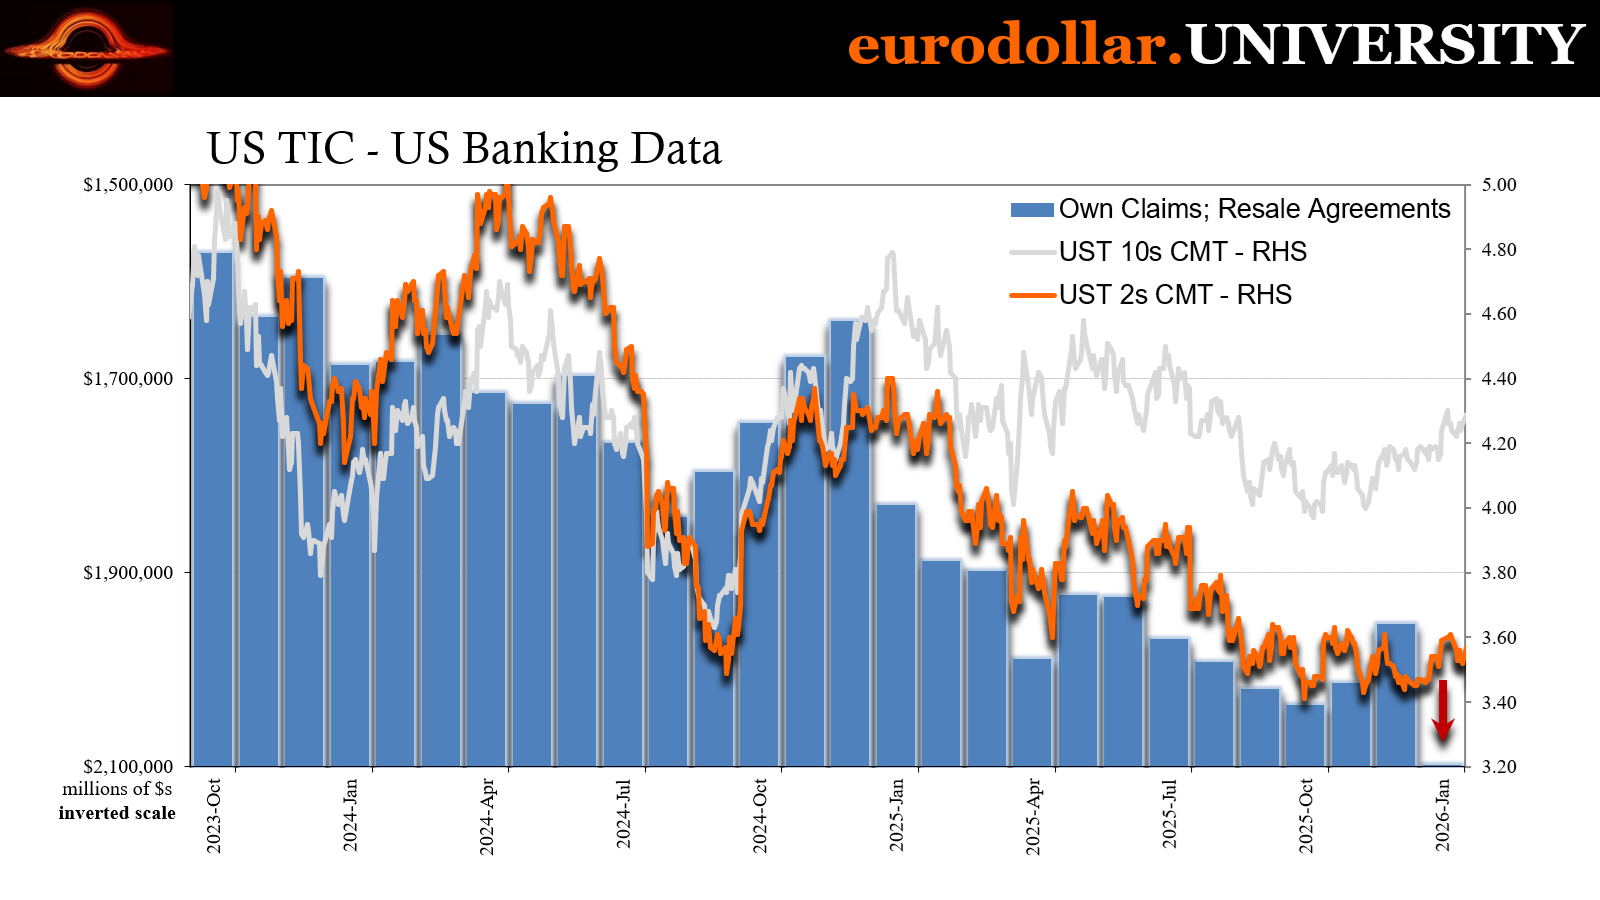
That view is bolstered by the fact the UST market did end up doing what resales indicate it was “supposed to” in February. Maybe that’s close enough. Dramatic January tightening according to several TIC series, not just resales, supporting bond market buying if slightly out of phase on the calendar.
And it’s another relationship which importantly sets the stage for the system just before the oil shock arrived at the very end of February. Central bankers see inflation all over the future where deflationary fragility is and has been already happening.
There’s still one more piece of corroboration from TIC and that’s the use of reserve assets by private bondholders. This group of financial participants normally won’t sell out of especially US Treasuries unless forced to do so by the more impactful dollar shortages. According to the data, private owners dipped into their reserve assets in three of the last four months including January.
Like everything else, this has nothing to do with “Treasury rejection” or whichever monetary fantasy the dollar doomers are trying to sell via Xi Jinping.
In totality, TIC provides a further basis for systemic effects of the private credit bust/crisis, ongoing and even accelerating risk aversion among money dealers combined with growing stress on offshore borrowers. Unfortunately, like anything eurodollar related, we are left with several questions due to expected holes in the shadowy picture.
Even so, with the data in hand there is even less reason to suspect inflation ahead no matter how high oil prices might go in the meantime. In reality, the higher petroleum soars and the longer it stays there, the more we would expect the weight of energy to add to these thoroughly-established deflationary circumstances.
But expect nothing less than the total opposite view from central bankers until the consequences of the above finally force the next series of Pringles.