PANIC BUYING PROVOKING PANIC OVER SELLING
EDU DDA Sep. 23, 2026
Summary: The energy shock pulled production and consumption forward as businesses prepared for shortages and consumers tried to avoid higher prices. The resulting artificial high was mistaken by the Fed and mainstream forecasters for durable resilience. That interpretation is now being challenged by renewed weakness in the CFNAI, New York services, Richmond manufacturing, and motor-vehicle production. Kroger’s supplier disputes show that consumers cannot easily absorb additional increases, while continued pressure in diesel and gasoline means cheaper crude may provide limited relief. As the borrowed activity fades, the economy is returning to its weak underlying trend, helping push the 2s10s Treasury curve back toward inversion.
From 4.20% on August 27, around the time of Jackson Hole, the two-year surged today to a new high of 4.85%. While this kind of volatility is always presented as something brand new and therefore it must indicate something momentous, the truth is it is not historically unusual when markets approach an economic or policy transition. Short-term yields can rise rapidly as traders reassess what the Federal Reserve might do, even when the broader bond market remains unconvinced that inflation or economic growth will persist.
The proximate cause was September’s S&P Global PMI data. US private-sector activity seemingly soared, echoing August’s unusually strong retail-sales estimates. But the details — including rapidly accumulating backlogs and sharply lengthening supplier delivery times — look less like the start of a durable expansion than a temporary if intense scramble to buy before energy prices, borrowing costs, or material shortages worsen.
Europe reported a milder version of the same phenomenon, further establishing the real culprit. Either the global economy spontaneously rediscovered robust growth amid major uncertainty and painful energy costs, or those very pressures caused businesses and consumers to front-load activity in a panic.
The timing supports the second explanation. The acceleration began around July and August, alongside the second phase of the energy shock, as the world increasingly recognized that higher costs are going to persist. Nevertheless, officials are just as likely to see the data as comparable to 2022 and thus become even more hawkish, fearing accusations that they once again underestimated supply shock “inflation.”
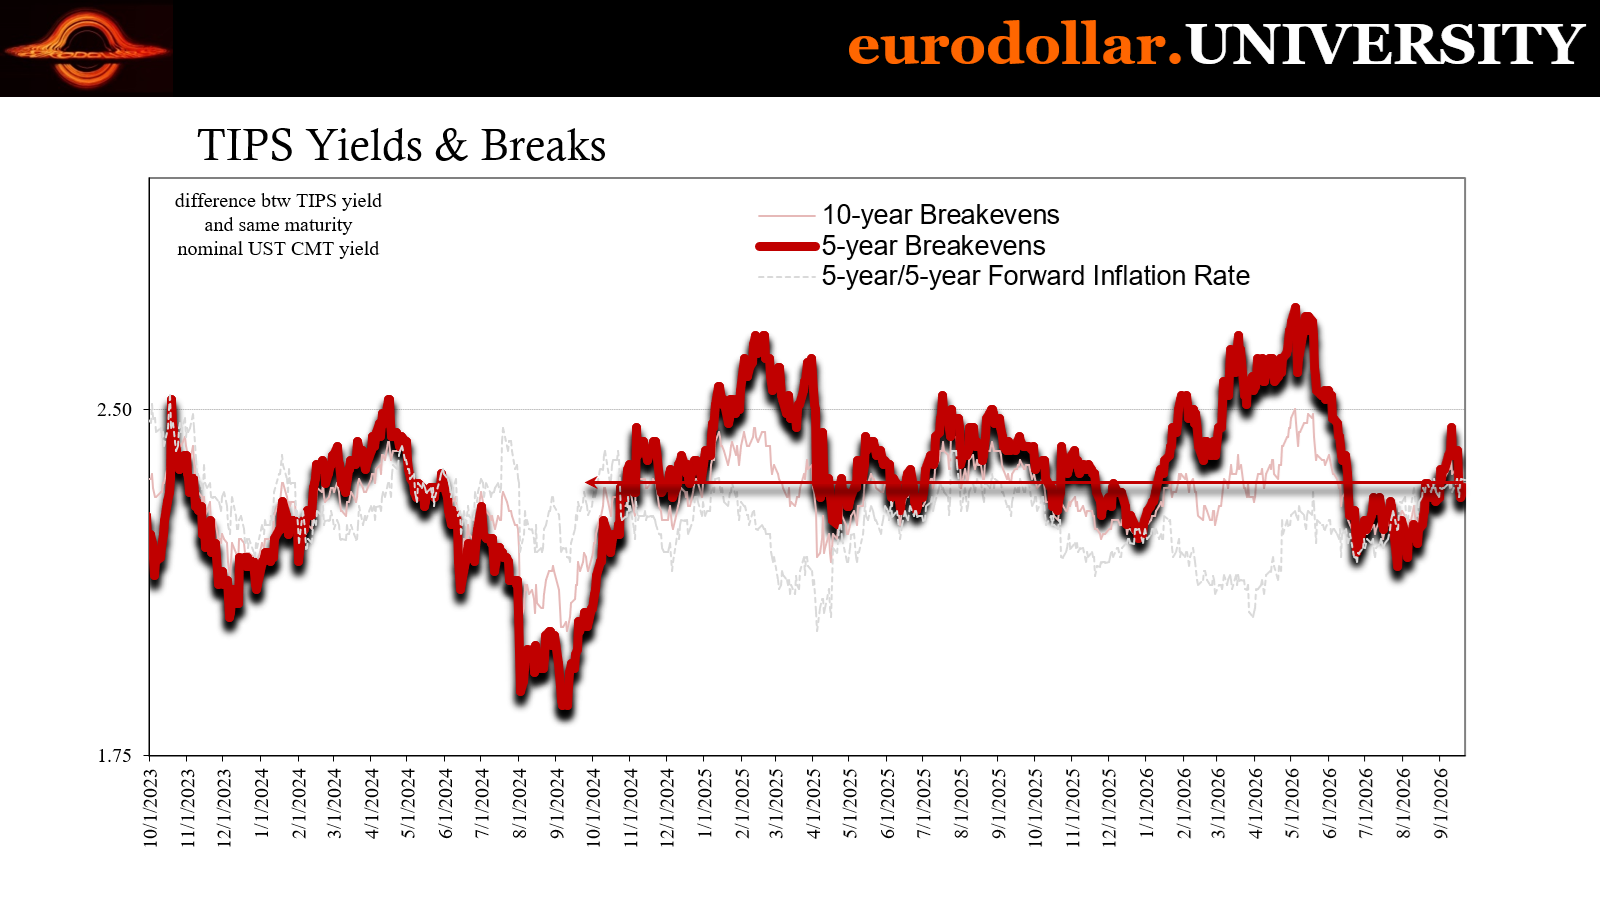
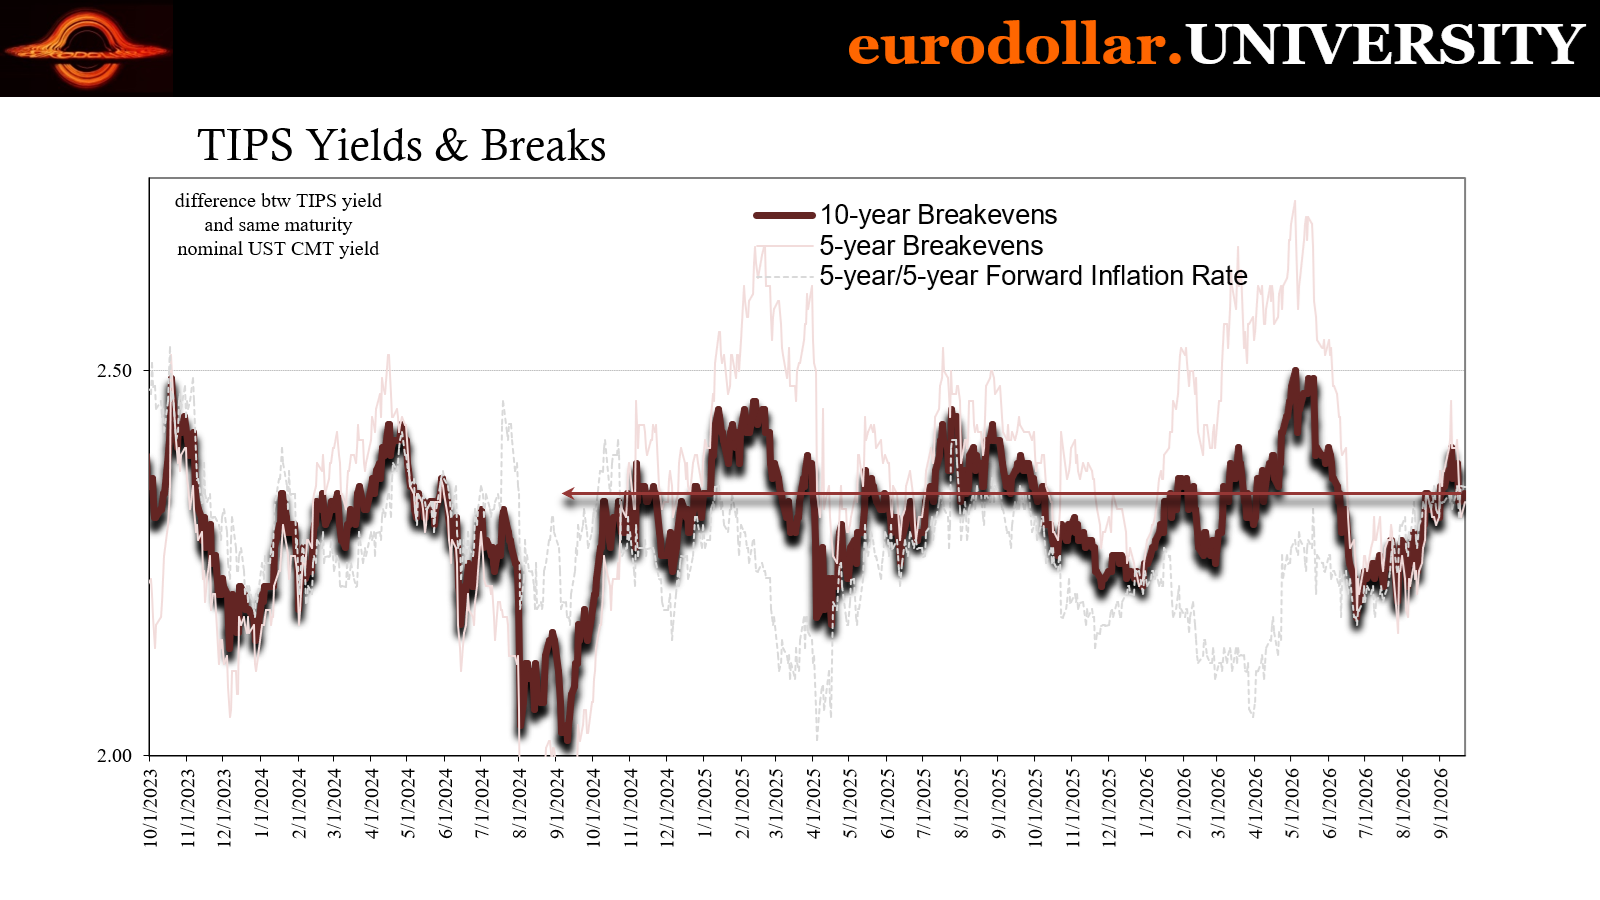
That policy risk is what the two-year yield is pricing (as always, we know it’s not inflation thanks to TIPS breakeven rates that didn’t even move on the day).
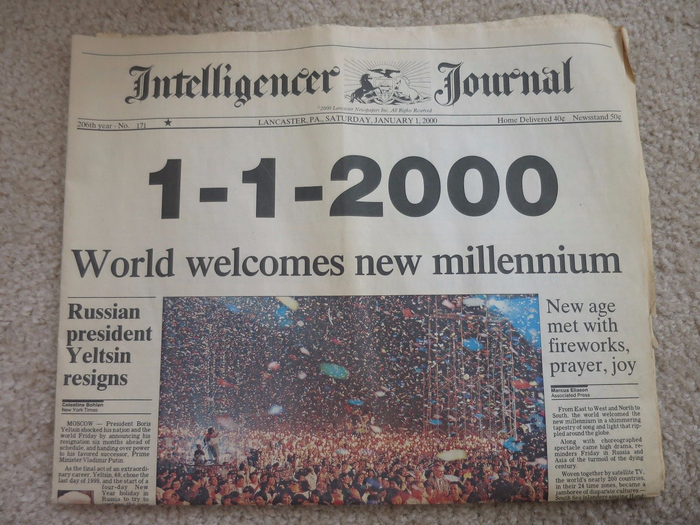
Rather than represent some brand-new discovery, we’ve actually seen this before many times. Similar episodes occurred in 2018 and 2000, while mid-2008 provides a third example we’ve discussed previously. In each case, short rates jumped, curves flattened, and policymakers focused on inflation that the bond market didn’t believe would last – because it didn’t.
Even the 60+bps increase in the 2s in just a month is hardly unprecedented. That kind of volatility should be expected because it’s common during transition periods like this one.
PMI surge more warning than celebration
On the surface, September’s US PMI figures were extraordinarily strong. The Composite PMI rose from 56.0 to 58.4, its highest reading since July 2021. The Services PMI increased to 58.7, while the Manufacturing PMI reached 57.0 and manufacturing output climbed to a 53-month high. New orders accelerated in both sectors, and employment rose at its fastest pace since June 2022.
Read mechanically, the results suggest a broad and increasingly powerful expansion. They appear to confirm the Federal Reserve’s worst fears: demand is accelerating, companies are hiring, costs are increasing, and the economy may be capable of absorbing still higher interest rates while it takes the hit from energy and keeps spending. That interpretation helps explain the sudden repricing of the policy-sensitive two-year Treasury.
The problem is that the internal details don’t describe a normal, sustainable upswing. Our first clue is just how much the surge sticks out like a sore thumb. That’s not how sustainable, long run recoveries happen.
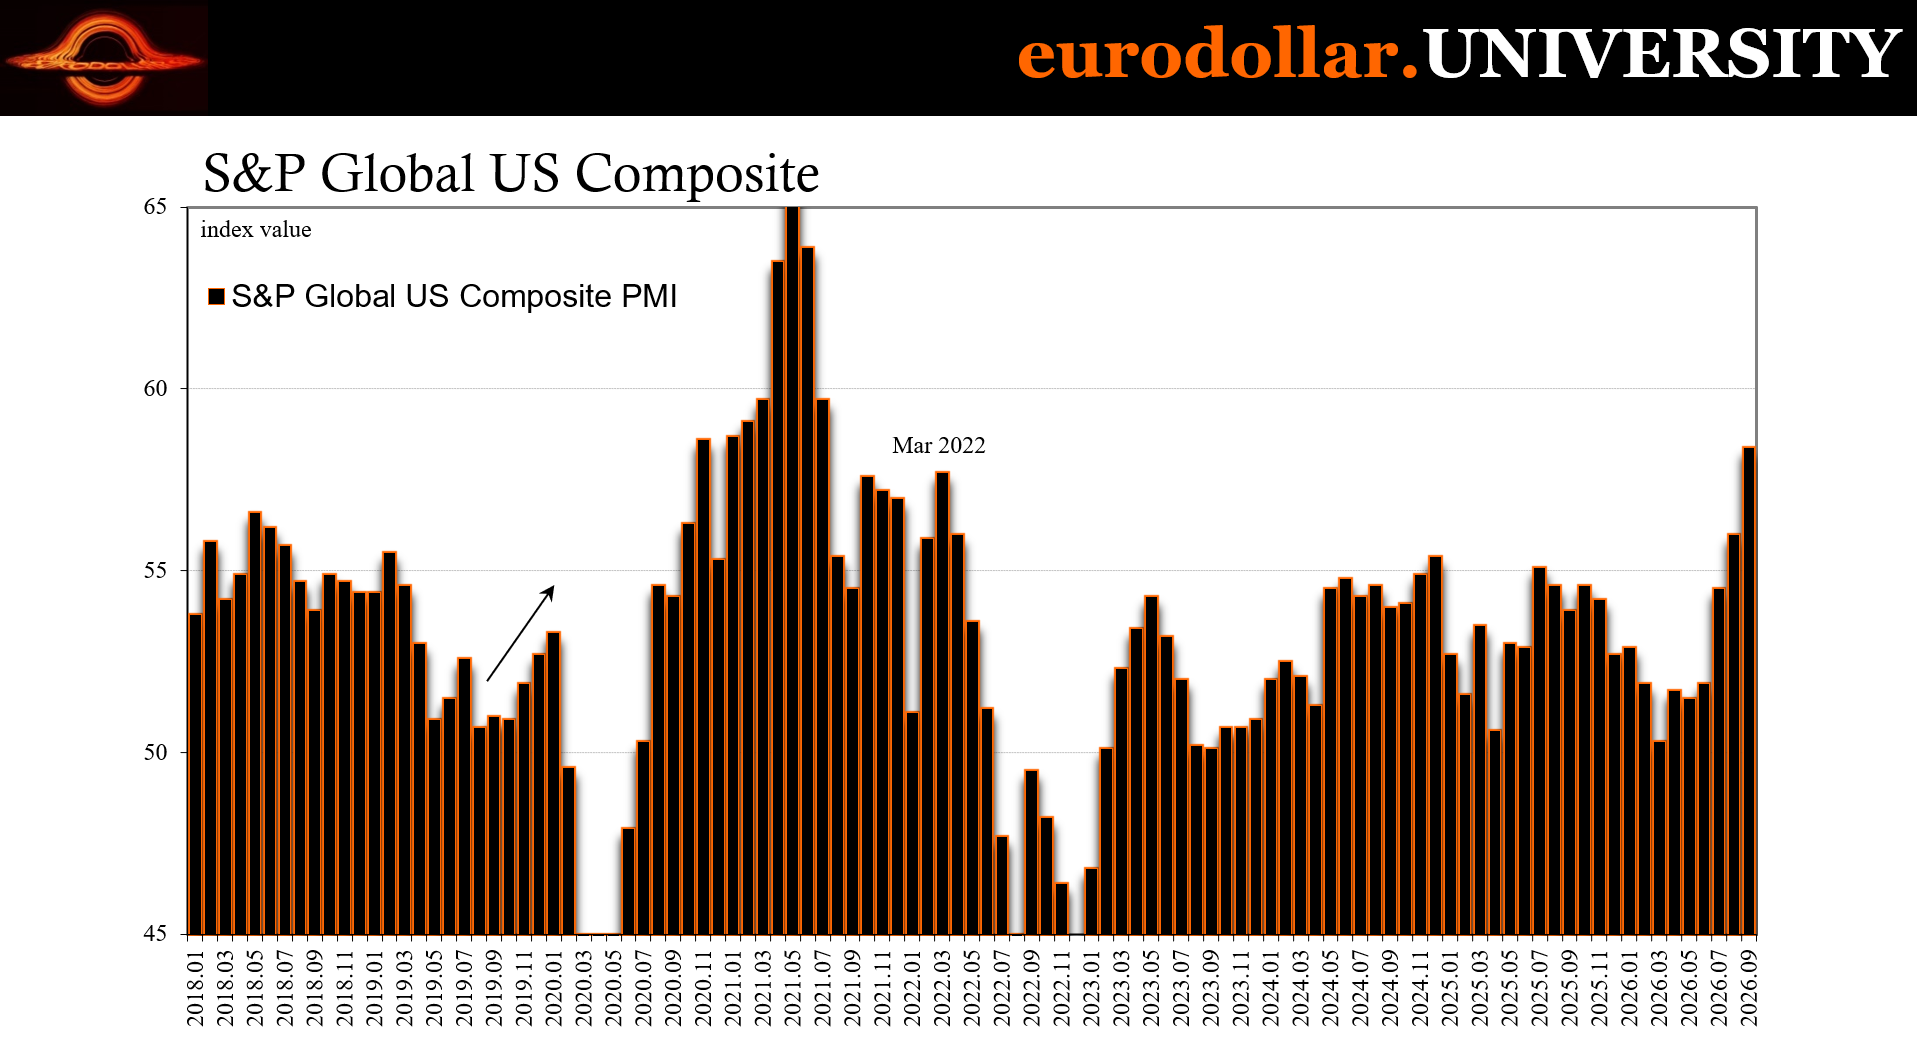
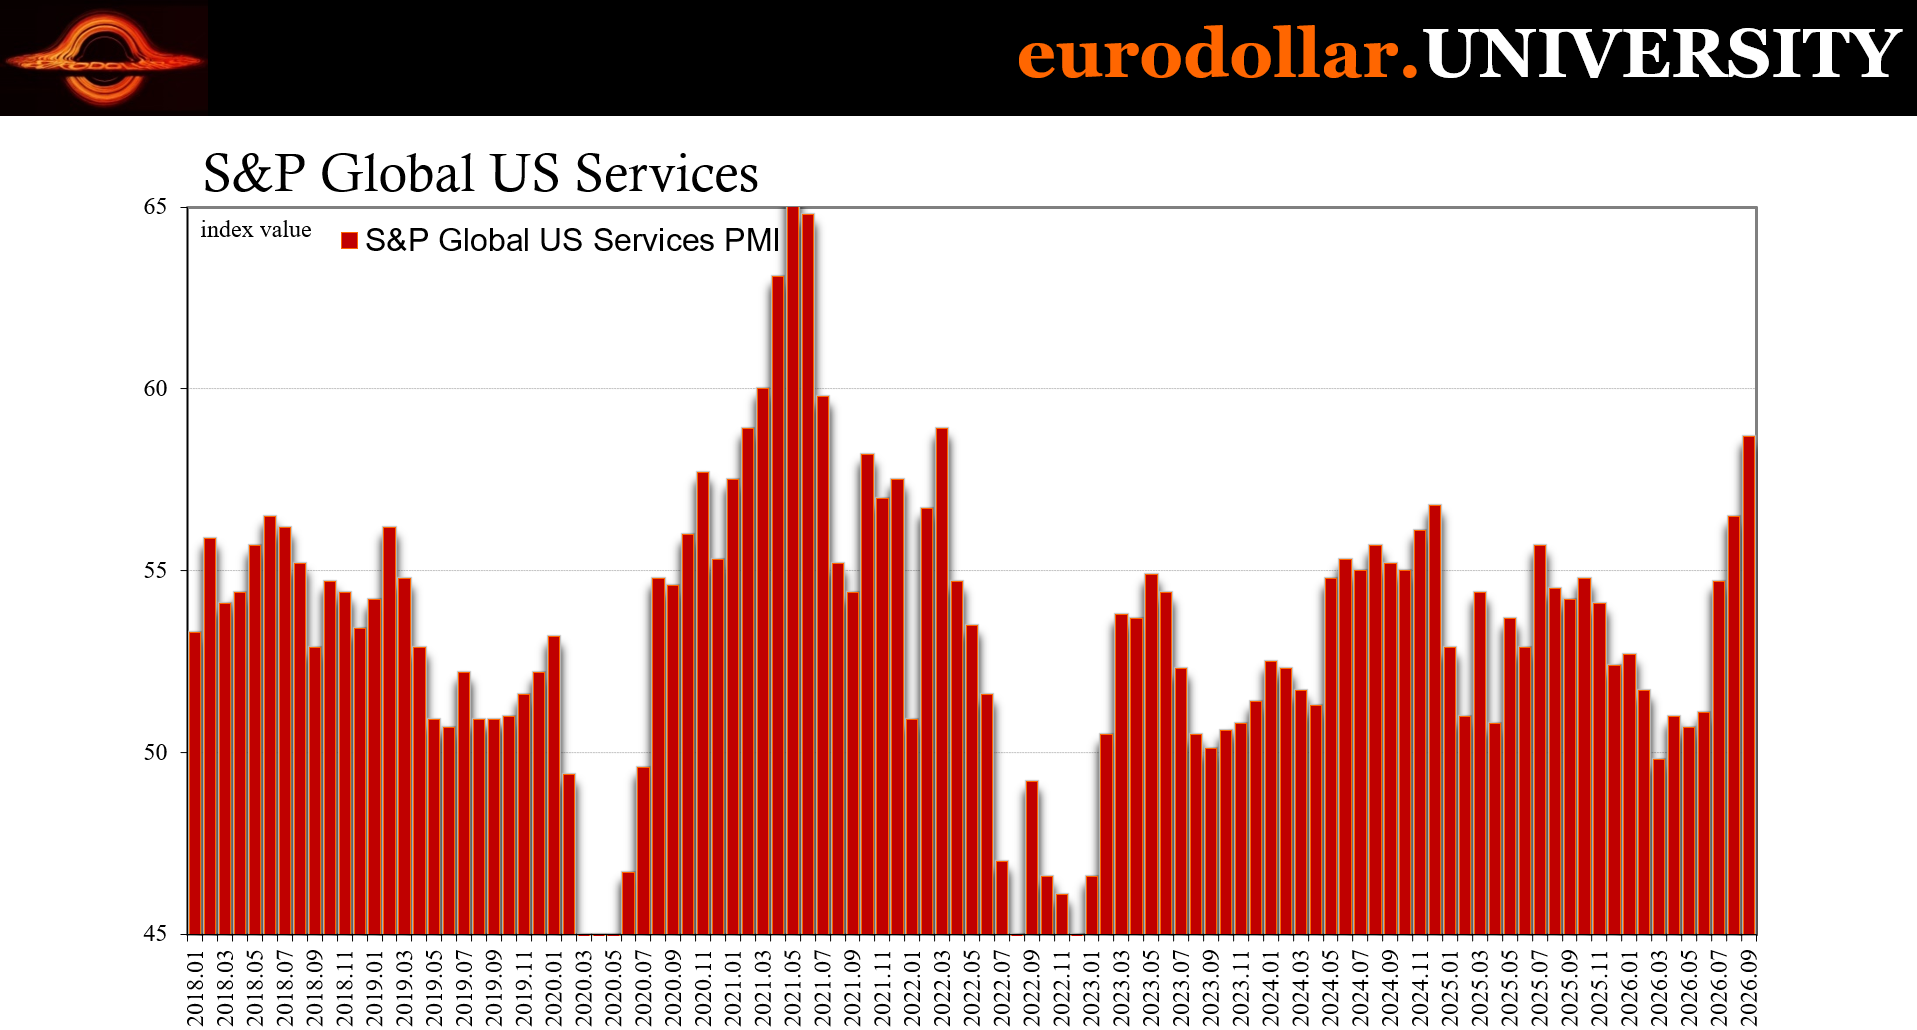
Backlogs accumulated at their fastest rate since May 2022, while supplier delays became the most widespread since July 2022. Those two features are especially important. In a healthy expansion, stronger orders may be accompanied by growing production, improving capacity, rising productivity, and orderly hiring. Here, incoming demand increased too rapidly for companies and supply networks to accommodate it.
Businesses were not simply expanding; they were clearly scrambling.
Manufacturing inventories also increased as firms attempted to rebuild buffers against potential shortages. Input-cost inflation accelerated to its highest rate since October 2022, driven by energy, transportation, and raw materials. Yet selling-price inflation remained below the rates recorded earlier in the year, meaning margin compression which will, before too long, sap the desire of companies to add employees. Firms were experiencing higher costs, but competition and weak underlying customer demand limited their ability to pass those costs through fully.
That’s just not the profile of an economy entering an inflationary boom. It is more consistent with temporary panic behavior. If companies expect diesel, freight, materials, and financing to become more expensive — or fear that supplies might not be available at all — they have an incentive to place orders immediately if only just to see what they might get. This is, you might remember, exactly the kind of panicky behavior that dominated 2021 and 2022.
This pulls future activity into the present. Orders, employment, inventories, and backlogs rise together, temporarily making the economy appear stronger than it really is.
August retail sales carried the same warning. The short-run burst was impressive, but its abruptness made it suspect. Sustainable advances usually develop across time and are supported by income, productivity, external trade, and broad improvements in demand. Panic buying instead produces an unusually sharp spike followed by payback once inventories have been accumulated and purchases brought forward.
Global scramble driven by the shock of the shock’s durability
The US’s PMI burst was not alone. Eurozone activity also accelerated in September, with the Composite PMI increasing from 52.0 to 53.1, its strongest reading in nearly three and a half years. New orders rose at their fastest pace since May 2022, while backlogs increased for the first time since June 2022. Manufacturing output reached a 55-month high, and both input costs and selling prices accelerated as higher fuel prices moved through European businesses.
The European improvement was smaller and more uneven than the American surge. Germany benefited from a recovery in services, while France returned to marginal growth after ten months of contraction. French manufacturing remained weak, export orders continued to decline, and employment fell again. Business confidence across the euro area also deteriorated rather than confirming the headline acceleration.
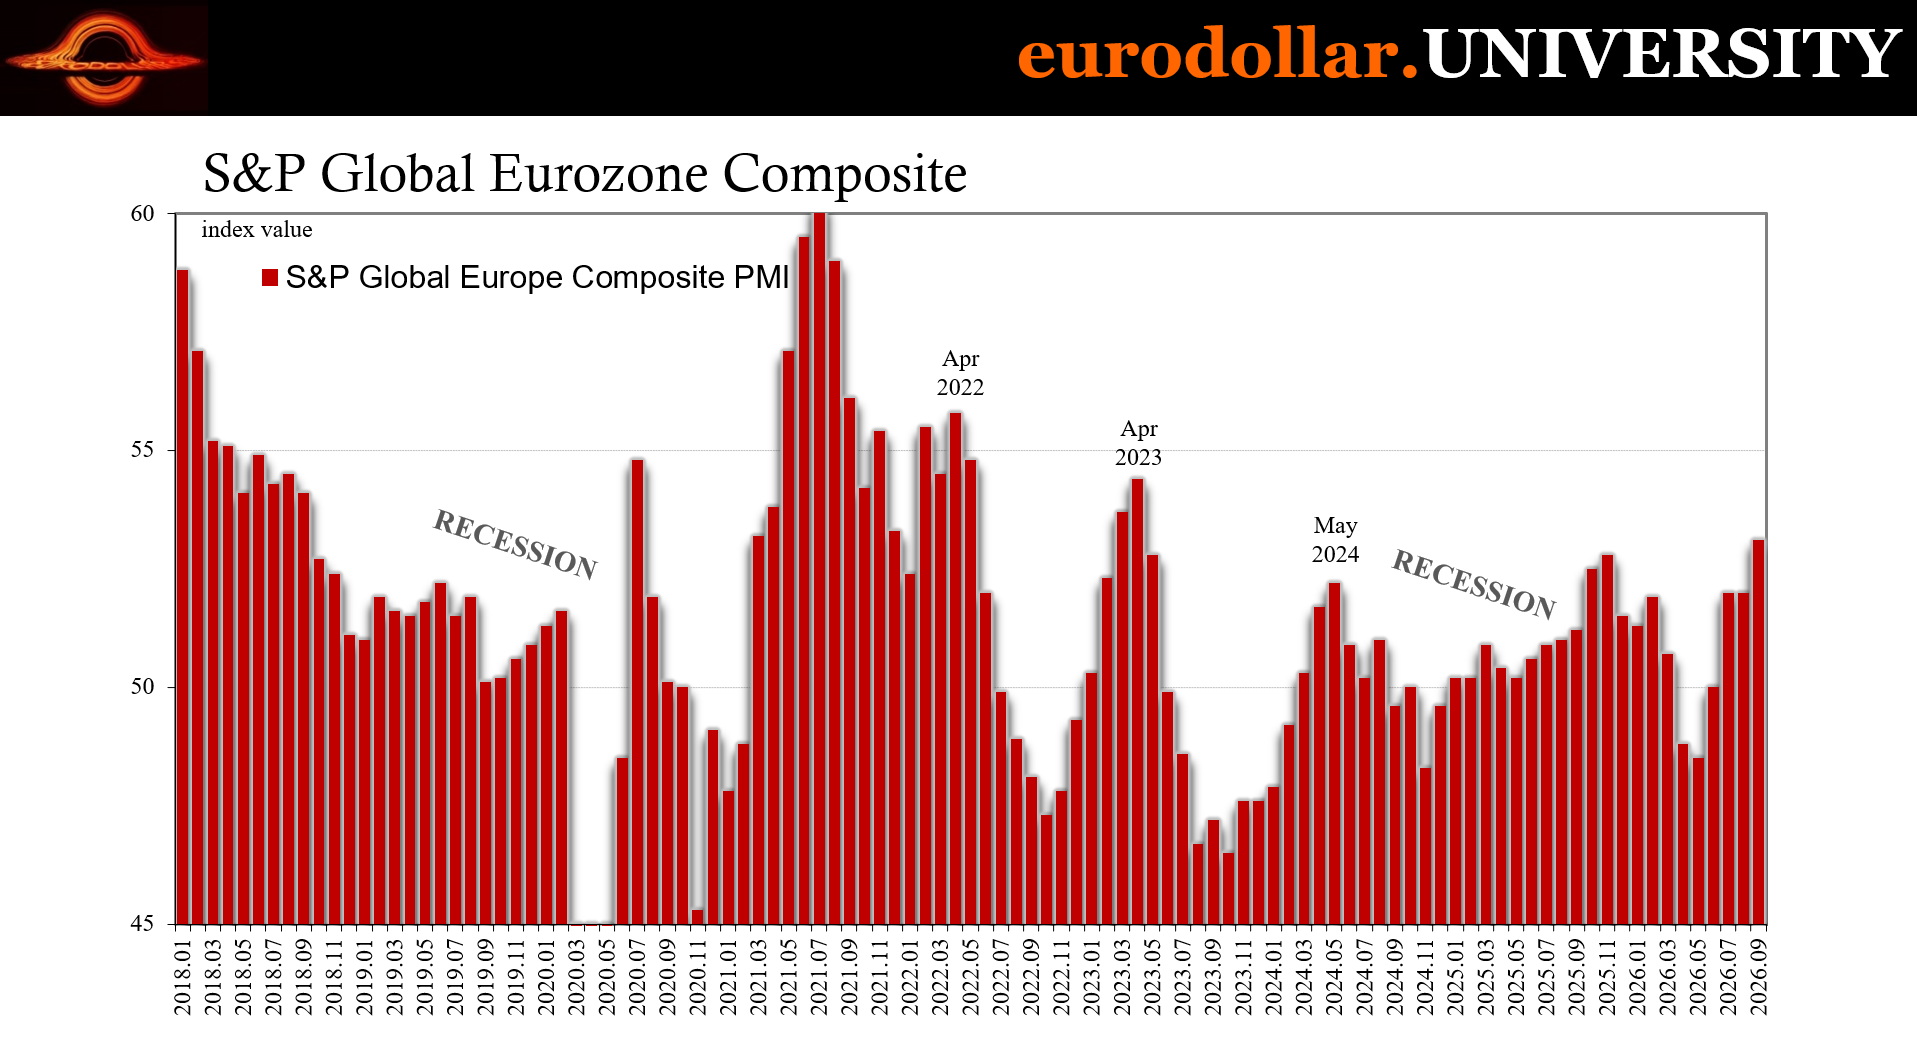
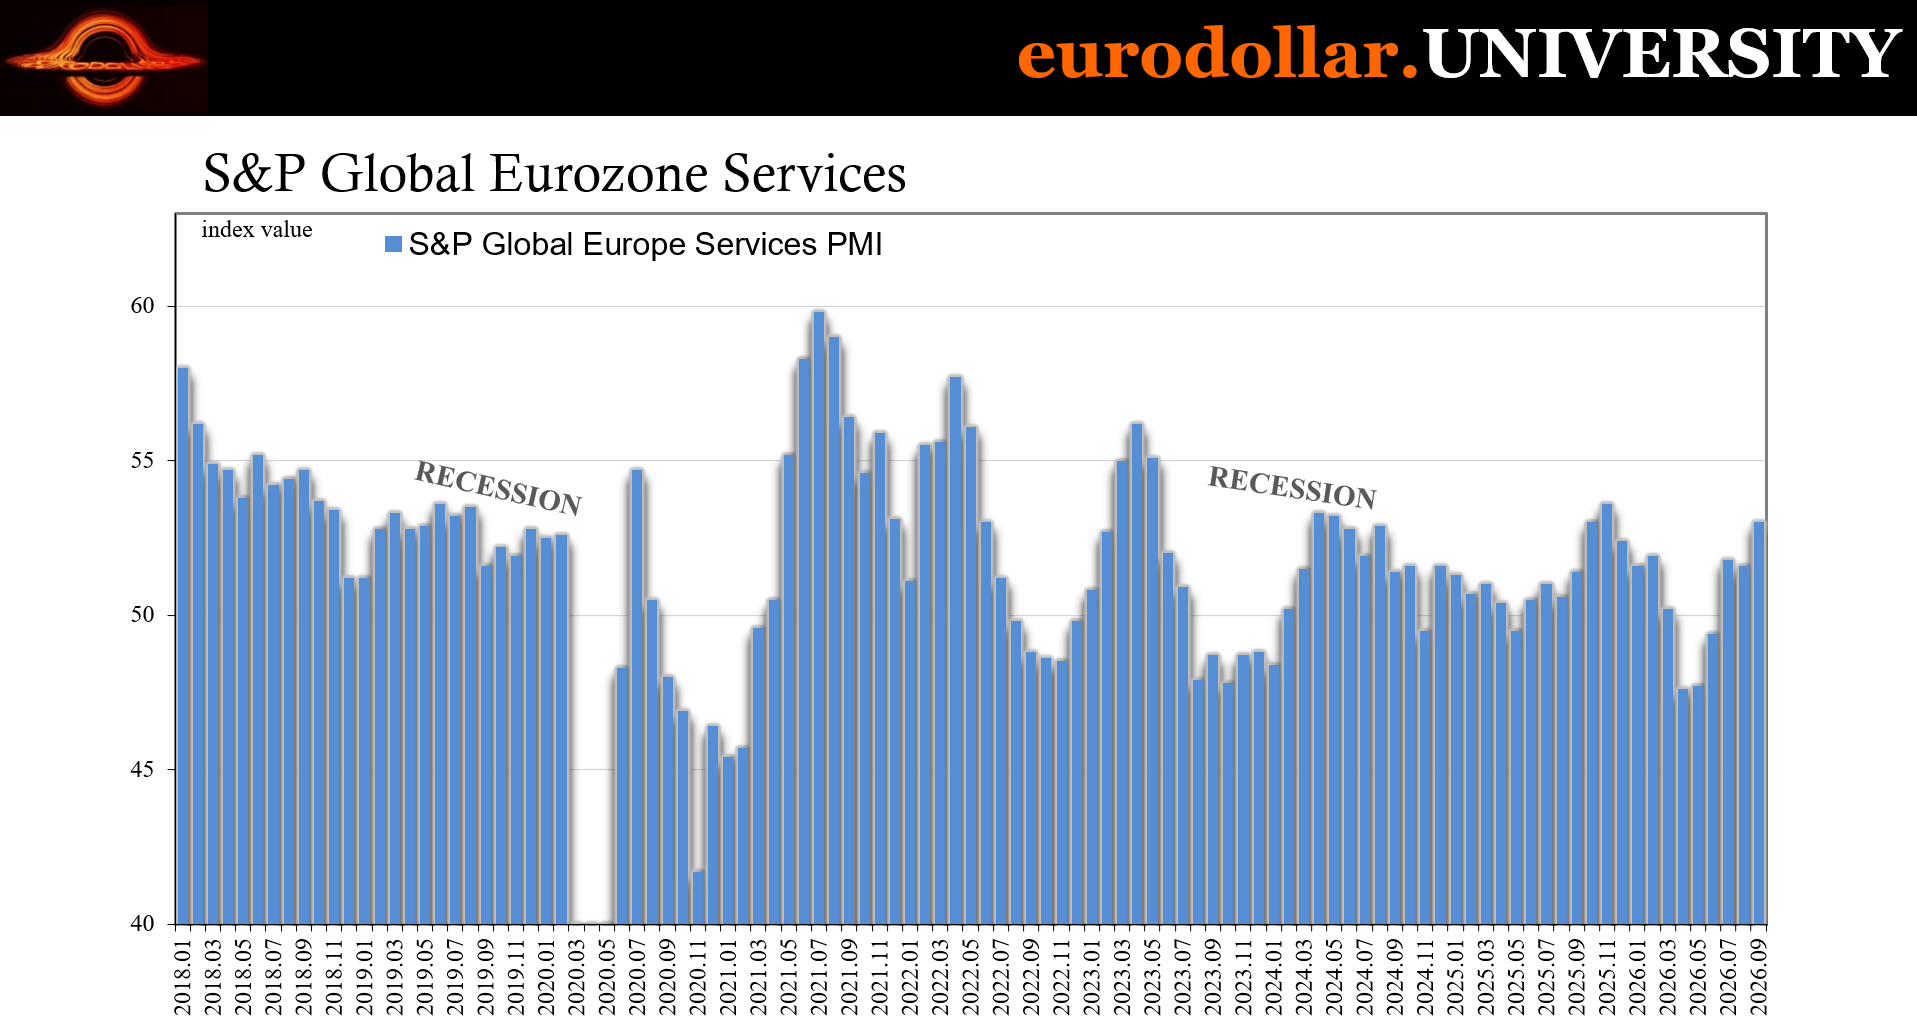
Still, the simultaneous movement gives away the underlying case because we’re forced to pick between only two possible extreme interpretations. The first is that the American and European economies independently and suddenly remember how to do rapid growth after years of forgetting and in spite of geopolitical uncertainty, weak global trade (apart from AI), not to mention the increasingly painful energy shock everyone now expects to become even more painful.
Or those constraints themselves provoked a synchronized effort to front-load purchases and production in a progressively frenzied outlier fashion.
The second explanation is much more consistent with the details. US growth was driven primarily by domestic orders rather than exports. European firms cautiously rebuilt inventories and increased purchasing, but they failed to demonstrate confidence in a durable expansion. In both economies, backlogs and delivery delays increased. These are the fingerprints of buyers trying to get ahead of anticipated trouble.
The timing reinforces this conclusion. The initial acceleration appeared around July and August, before September’s much larger PMI jump. That period coincided with the second stage of the energy shock. The first stage was the price increase itself. The second began when firms and households realized this thing isn’t going anywhere.
That change in expectations alters behavior. A business that believes fuel costs will fall next week can wait. One that expects expensive fuel, transportation bottlenecks, material shortages, and even higher interest rates for several months or longer is going to hit the order button immediately. Multiplied across an economy — and then across several economies — the result is a temporary burst that superficially resembles robust growth.
The stronger the burst, however, the more demand has been borrowed from the future. Front-loading doesn’t create purchasing power, productive capacity, or a sustainable recovery. It merely changes timing and makes activity more lumpy, resembling mini-cycles.
The 2s did it
The two-year Treasury yield is highly sensitive to expectations for the federal funds rate. Its rise from 4.20% on August 27 to 4.85% means the data is more likely to provoke the Federal Reserve into more short-run Trichet. We know it’s not inflation thanks too TIPS.
Markets can expect officials to respond hawkishly while simultaneously believing that the response will weaken future growth and eventually force rates lower. That combination commonly produces a flatter yield curve: short-term yields rise with anticipated policy rates, while long-term yields increase less — or decline — as investors price the eventual economic consequences.
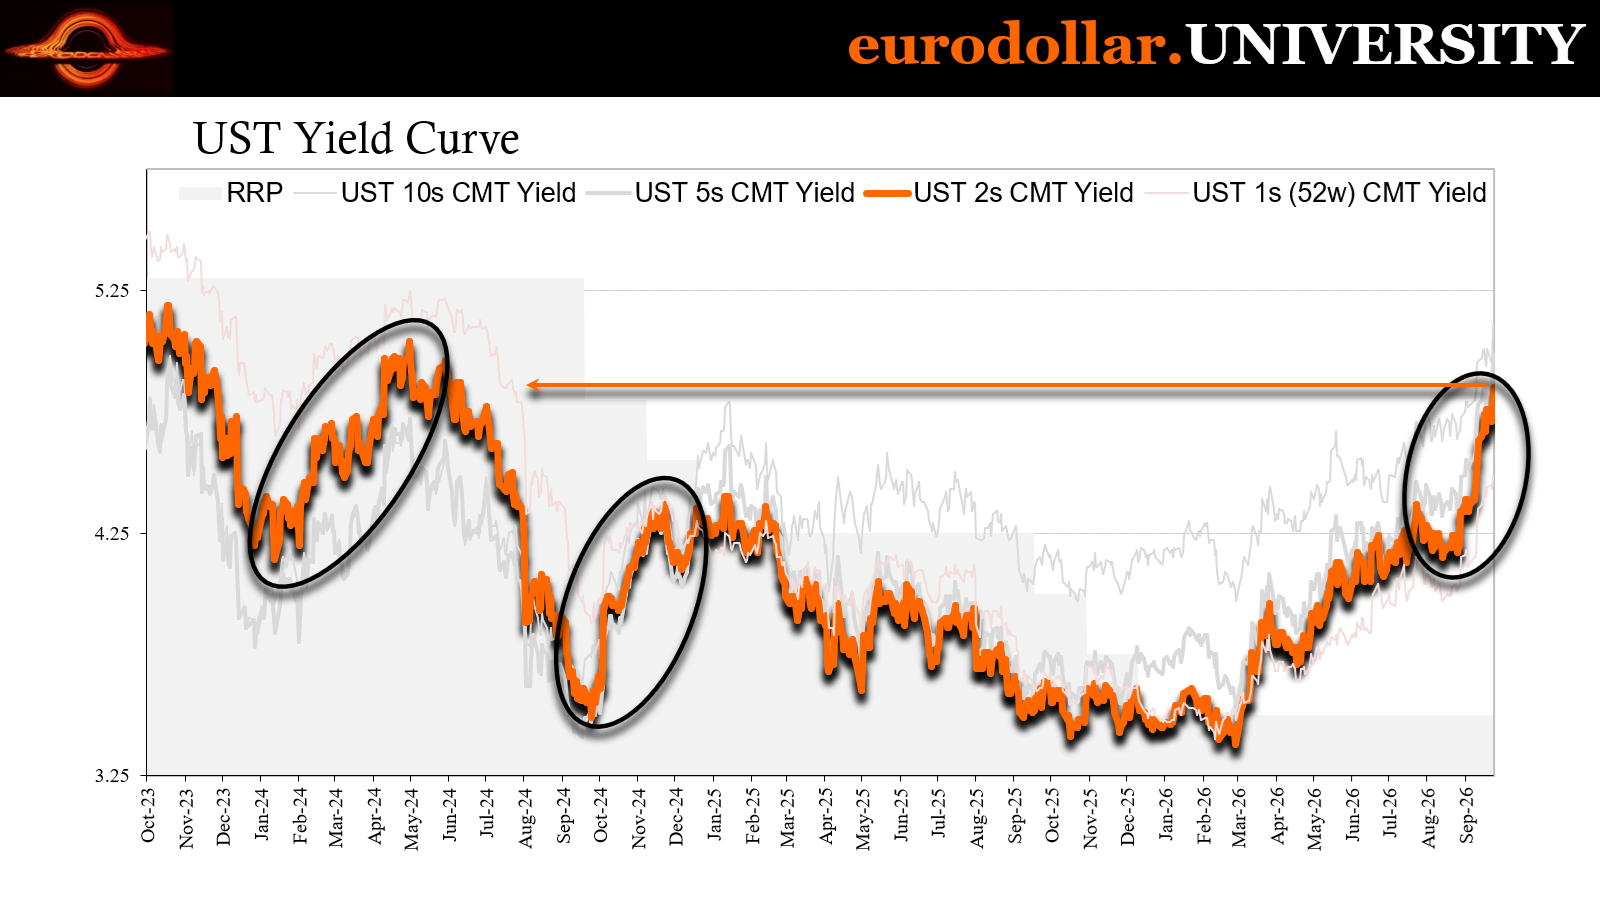
The comparison with 2022 makes another hawkish response more likely. Current supply disruptions are narrower than those experienced then, but officials face a political and reputational problem, one that current Fed Chairman Warsh has explicitly highlighted on several occasions. This is, in reality, the primary reason for any rate hikes in the first place (particularly when combined with uncertainty over R*).
The conventional story says Jay Powell’s Federal Reserve made a major mistake by describing the original inflation shock as transitory (even though it was). Policymakers may now feel compelled to prove that they won’t fail again.
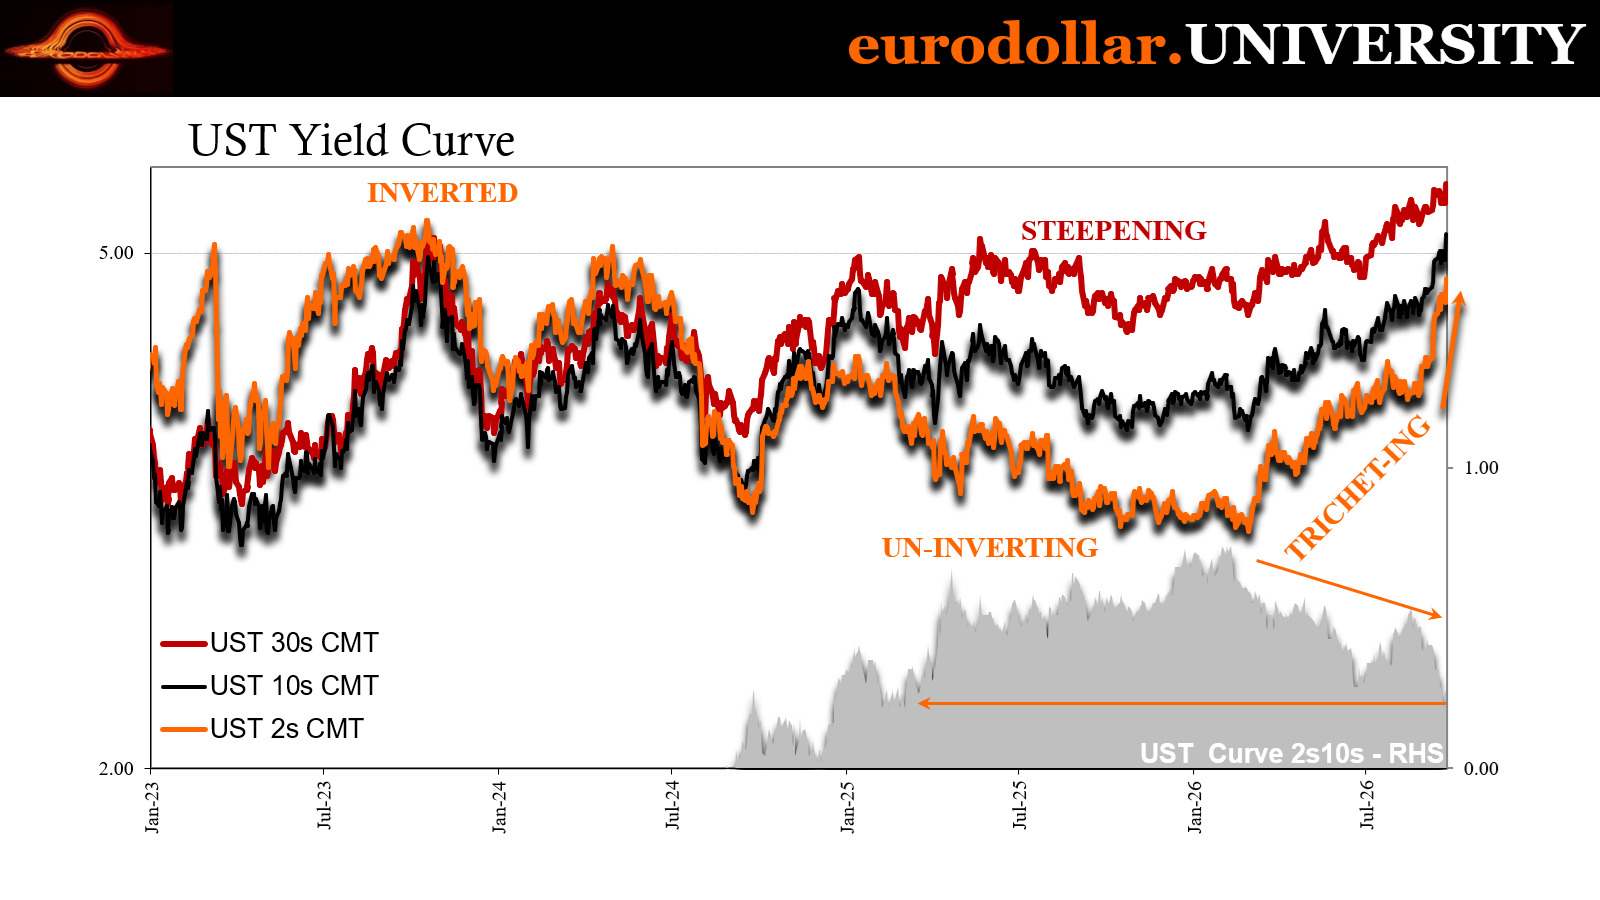
The inflation market recognizes this distinction. Despite the energy shock, stronger PMIs, and the leap in nominal short-term yields, TIPS breakeven rates have gone nowhere. They didn’t even budge today despite the latest rate surge. If the PMI report had convinced markets that a durable inflationary expansion was beginning, expected inflation should have visibly risen with nominal yields.
Instead, the adjustment was concentrated, once again, in policy expectations alone. The market sees a greater risk of Fed Trichet, not a greater probability of sustained inflation or a sudden durable boom in the economy. The TIPS market dispels any notion of the former, while the flat curve within reach of renewed inversion takes away the latter.
We’re left with Jean-Claude Warsh. And not for the first time; other than it’s Kevin in the hot seat this time around.
The 2018 transition
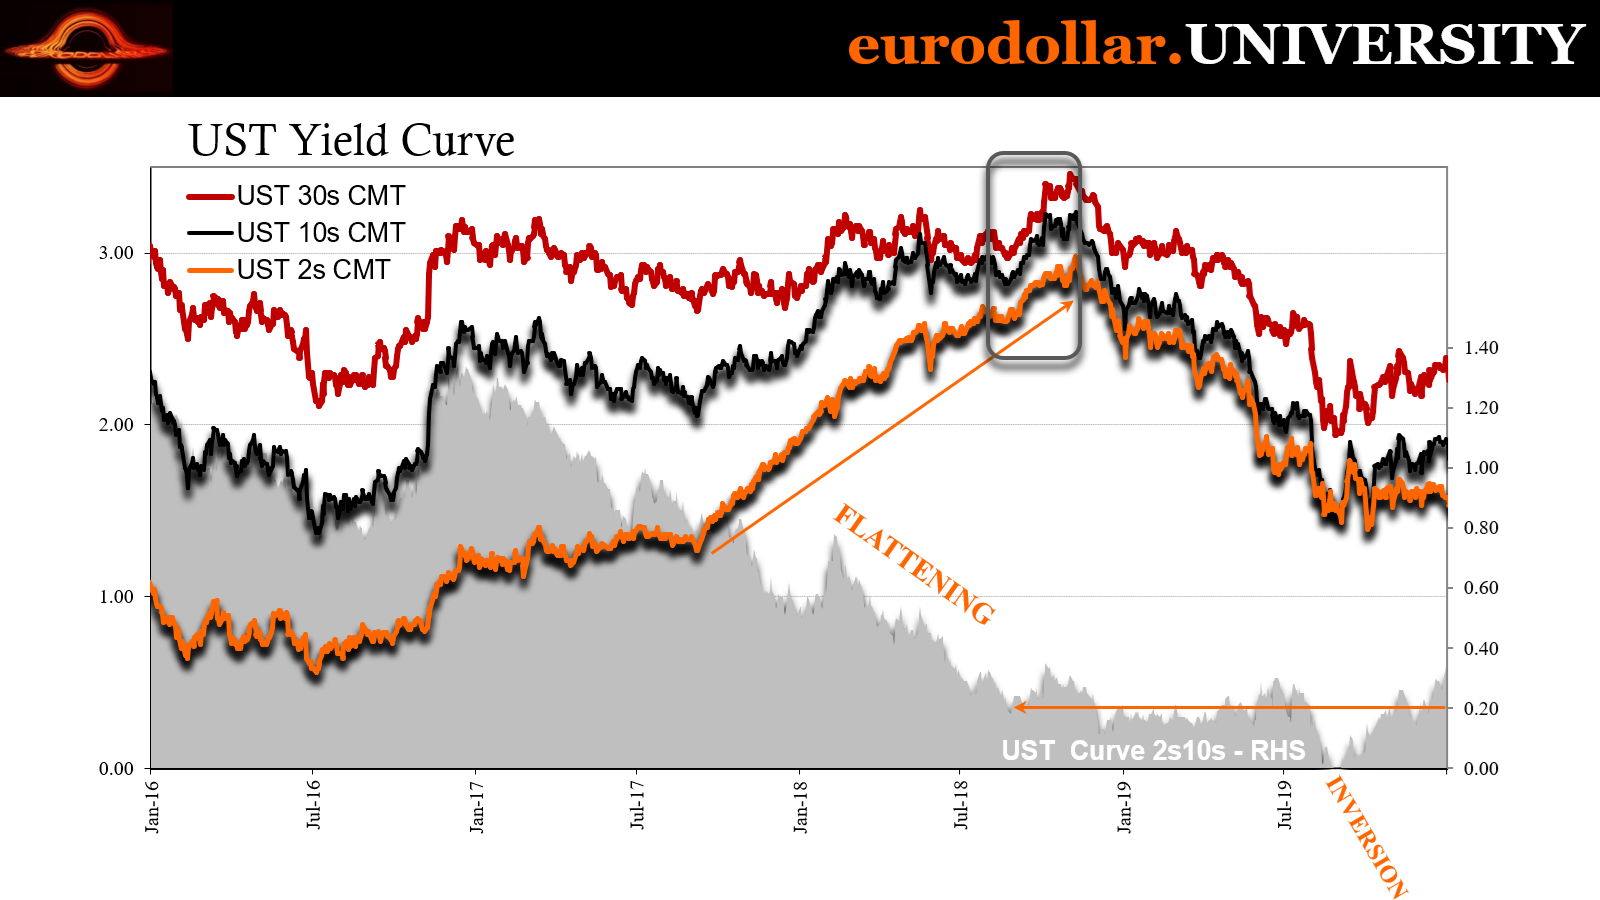
The first useful comparison is 2018. The two-year yield had already been rising since July 2017, climbing from 1.27% to 2.98% by November 2018. That longer move reflected repeated Federal Reserve rate increases and the widespread belief that tax cuts (TCJA of 2017), low unemployment, and supposedly synchronized global growth would finally generate stronger inflation.
The closest comparison really began in late August 2018, what ended up being the first concrete example of the “September effect.” From approximately 2.63%, the two-year yield rose to 2.98% by early November. At the time, that 35-basis-point increase was sharp and unsettled almost everyone in the mainstream in exactly the same way we hear today. After all, each tick higher at the 2s was the new highest rate in years, which was said to represent a very important, highly meaningful change (mainly that the 30-year bond bull was dead).
It was nothing more than arbitrary volatility driven almost entirely by bureaucrats trying to interpret an economy they little understand.
There were all the same basic concerns visible now: economic data appeared strong enough to encourage further Fed hikes, even though the broader market found little evidence of a durable inflationary regime. In fact, by August 2018, in addition to the yield curve (2s10s) flattening toward 20 bps, other curves were already sounding the alarm on the economy.
That skepticism proved justified. The world economy was losing momentum beneath the strong US headlines. Dollar pressure, weakening global trade, emerging-market stress, and deteriorating financial conditions became more visible as 2018 progressed. By the end of the year, markets were in turmoil. The Federal Reserve soon abandoned further hikes, and Treasury yields fell sharply.
The lesson is not that the current two-year yield must peak immediately. In 2018, it kept rising for months until the events finally forced the expected policy path to change. The lesson is that a sharp short-end increase can occur precisely because the market expects policymakers to tighten into weakness since they downplay it in favor of inflation bias, particularly when there is any hint of oil involved.
A flattening curve is therefore a warning, but not a precise clock. It can’t predict exactly when the Federal Reserve will recognize the problem, especially when the timing depends on how officials interpret noisy, lagging, and temporarily distorted data.
2000: A Rate Odyssey
The second comparison, 2000, is even closer. Consumer-price measures were running well above 2%, unemployment had fallen below 4%, and incoming economic data appeared robust. Oil prices had rebounded sharply from the lows produced by the Asian financial crisis a few years before, pushing consumer price rates higher and encouraging fears that price pressures would spread throughout the economy.
On May 16, 2000, the FOMC gathered around in Washington to debate taking more extreme measures. For nearly a year, Greenspan’s Federal Reserve had been “raising rates” in the now-familiar pattern. Adjusting their target for interest on federal funds, the Committee had by then increased it at all of the five previous policy meetings, each of them by a further 25 bps.
The Bureau of Labor Statistics (BLS) gave them some unwelcome news in between the March 21 meeting and the one in mid-May. On April 14, 2000, the BLS reported the US CPI had increased by 3.7% year-over-year (unadjusted) in March 2000. More concerning, the 3-month compounded change (annual rate) was 5.8%, suggesting that consumer prices were high and accelerating.
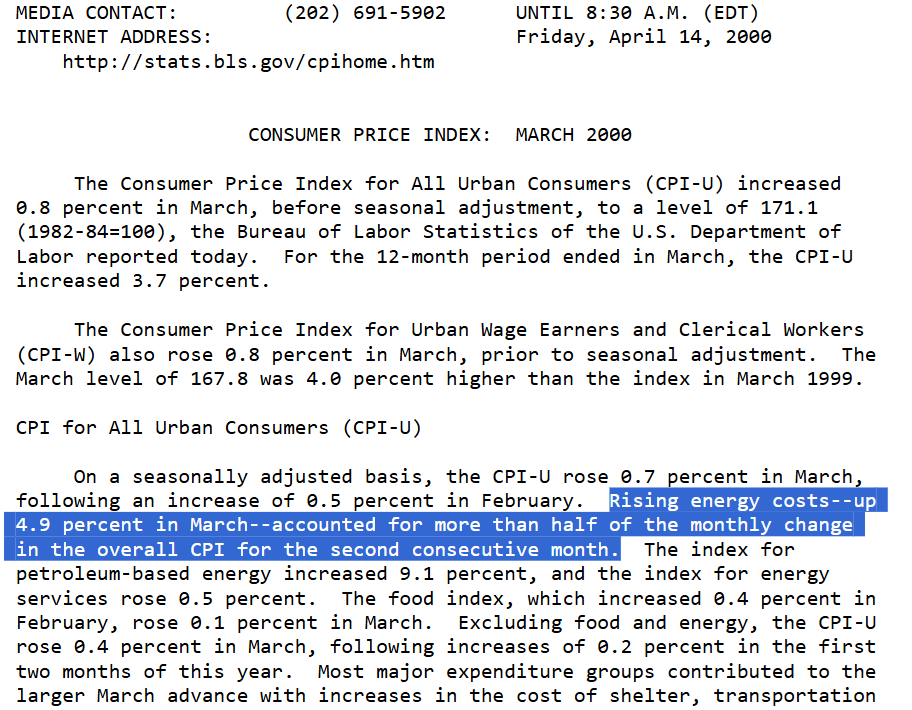
To make the comparison eve more compelling, the BLS wrote that half or more of the increase was due to rebounding petroleum costs.
These figures obviously concerned monetary authorities. They were, many believed, in danger of falling behind the Phillips Curve. Inflation pressures appeared to have caught up with a healing economy already operating close to traditional labor limits (it really should sound familiar even if Greenspan didn’t specifically use the word “resilient”).
As the accompanying Greenbook for May 2000 related in its staff projections:
Last month, the unemployment rate edged below the 4 percent mark for the first time in more than thirty years, a development entirely consistent with the anecdotal reports in the Beige Book and elsewhere of an extremely tight labor market. Against this backdrop, and with the effects of the steep run-up in oil prices of the past year filtering through the economy, we are not surprised to be seeing some signs of a general pickup in wage and price inflation. Nonetheless, the recent news, of which big jumps registered by the consumer price and employment cost indexes were only a part, has been striking enough that we have elevated our inflation projection slightly more than we might have solely on the basis of the higher resource utilization now in our forecast.
Based in part on those predictions as well as media pressures (and “hawkish” criticisms), the FOMC voted to step up their policy “tightening.” Everyone knew they were already in for another 25 bps, but Greenspan’s Committee wanted to send a message. This time, in May 2000, they voted for a 50-bps hike. Richmond Fed President J. Alford Broaddus explained:
MR. BROADDUS. We got a new CPI number this morning. Mike, you mentioned the 12-month change in the core CPI was 2.2 percent. I had called Richmond and my staff said the number was 2.3 percent for the 12-month period ending in April. It may have been 2-1/4 percent and the difference is in the rounding. In any event, it is approaching a rate that is 1/2 point higher than it was just a few months ago. So it seems to me that there is at least some evidence that we are at last experiencing some increase in actual inflation. And the staff's projection that the upward trend is going to persist strikes me as both reasonable and disturbing.
The two-year yield anticipated that move. From 6.31% on April 10, 2000, it surged to 6.93% by May 18 — a 62-basis-point increase in barely more than a month. That is remarkably close to the current move from 4.20% to 4.85%. What seems historically exceptional today was already visible during another period dominated by oil prices, apparently strong data, inflation anxiety, and an increasingly aggressive central bank.
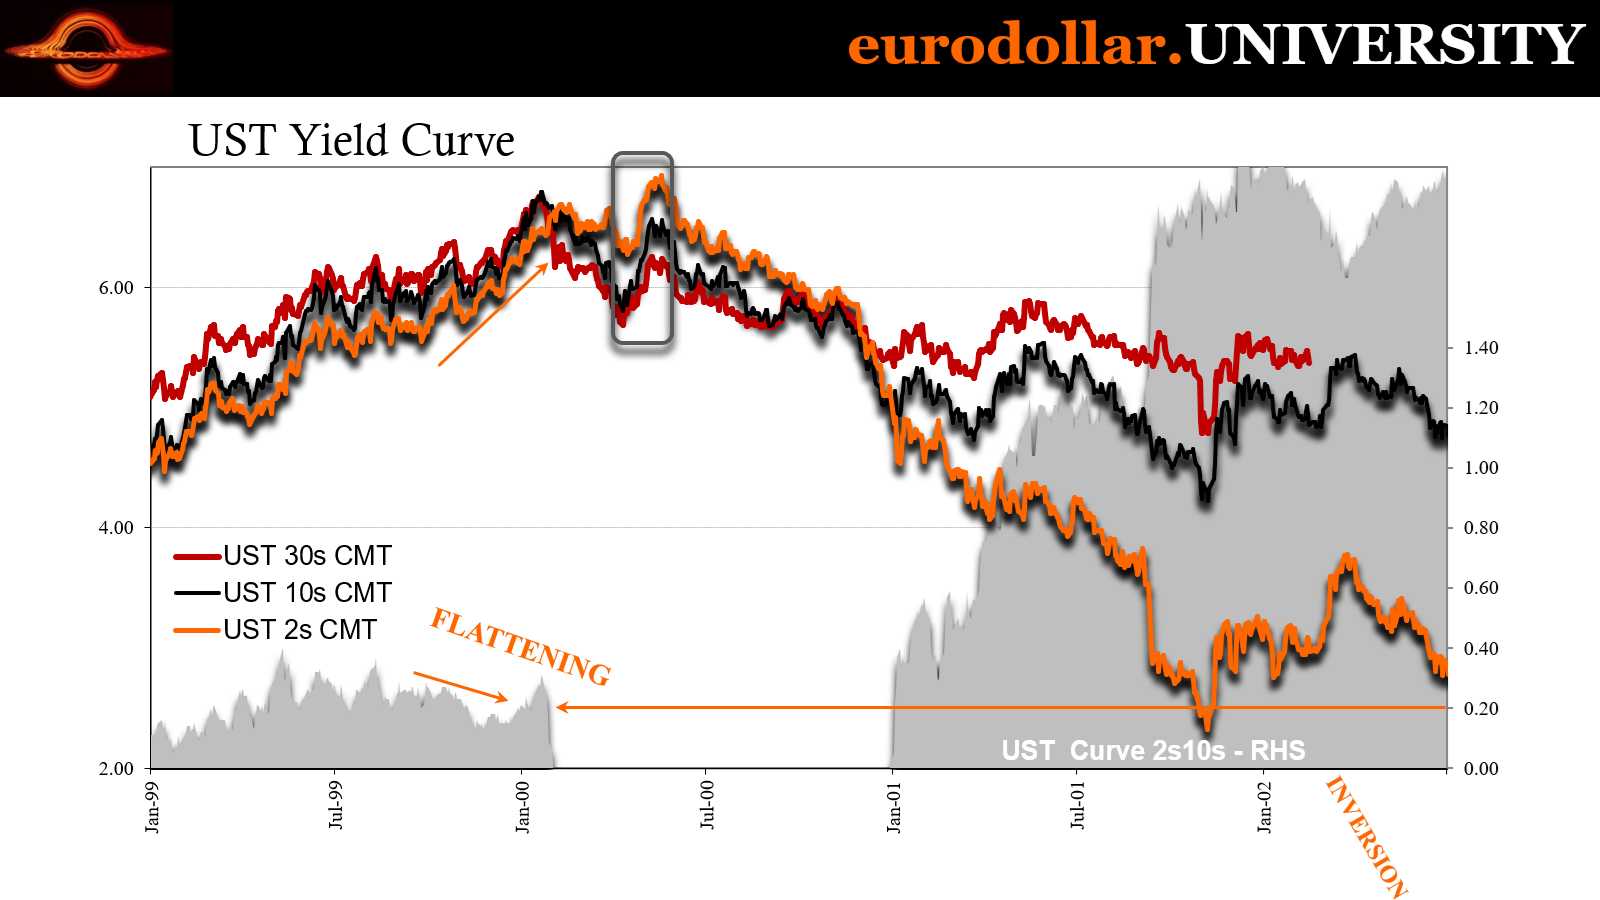
Plus also a deteriorating economy the long end of the curve was in the process of more completely sniffing out.
Long-term yields had peaked earlier, and the curve flattened and inverted as 2000 progressed. Even after temporary bursts of strong retail sales and industrial production generated sharp daily increases in rates (rate volatility), the long end continued to warn that demand was weakening.
Officials focused on the CPI, low unemployment, and models claiming the economy was overheating. The curve focused on what came next. The apparent inflation proved transitory, economic growth rolled over, and the dot-com recession followed ten months later.
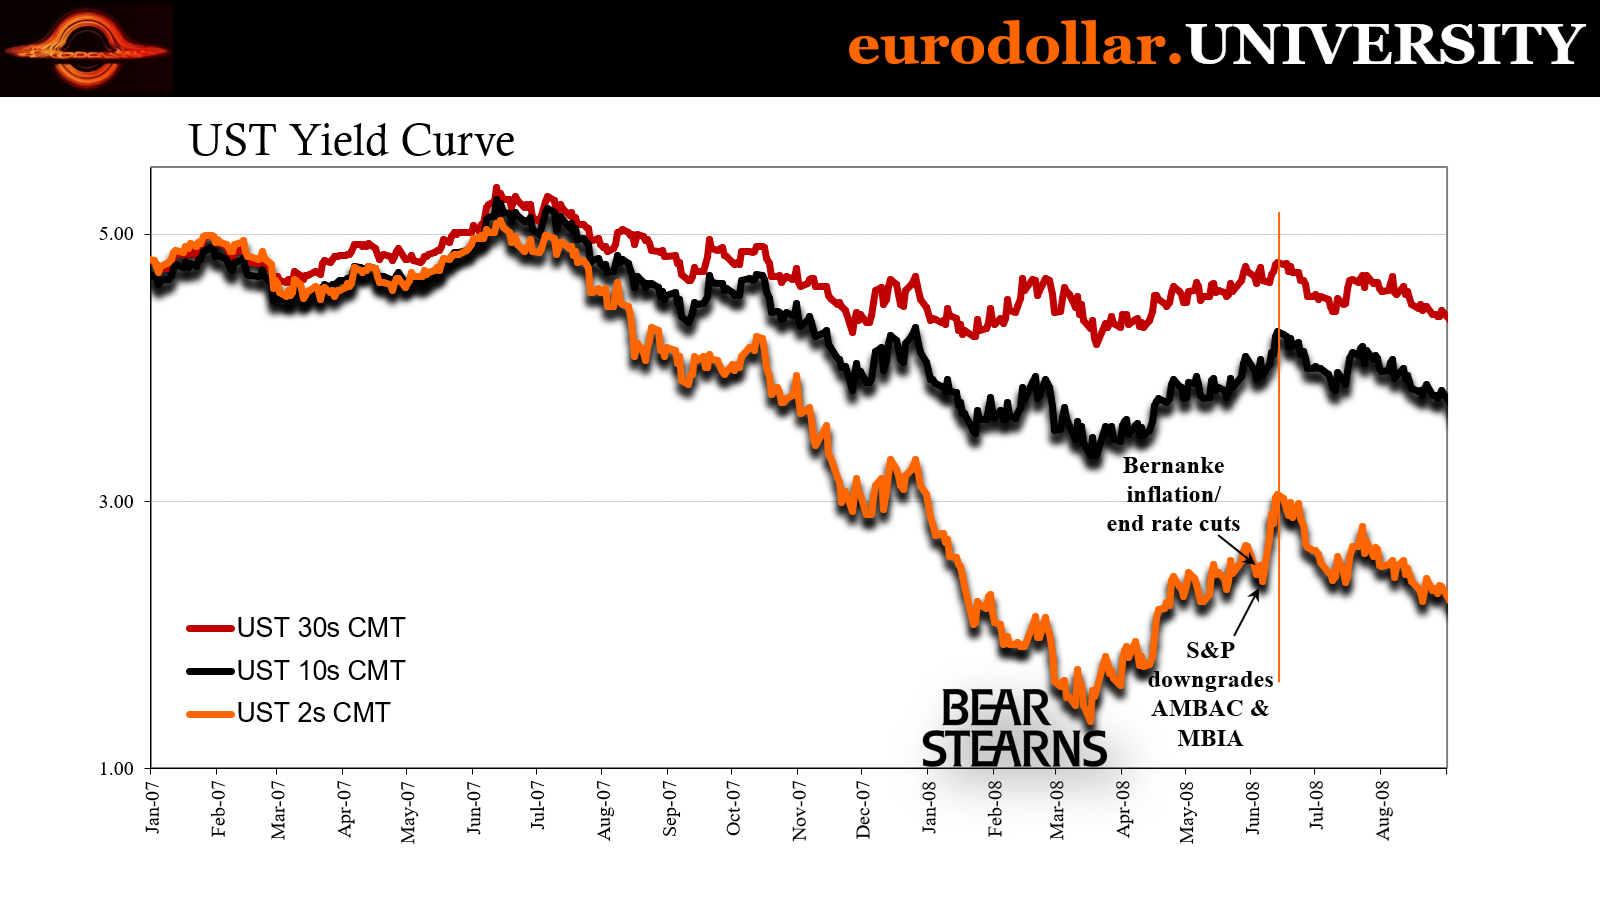
The third precedent is 2008. By the middle of that year, commodity prices and several consumer-price measures were surging even though the recession was already well underway. Services inflation excluding rent briefly moved above 6%, while oil and other commodities reinforced fears that emergency support and Federal Reserve “liquidity” programs would produce too much inflation.
Rates moved sharply higher, the 2s rising 170 bps off their Bear Stearns bottom, including that 65-bps surge in mid-June which happened in just five trading days following Ben Bernanke’s Warsh-in-Wyoming-like speeches at the start of that month. Today’s volatility is hardly unprecedented.
Officials and prominent commentators worried about overheating just as financial and economic conditions were deteriorating catastrophically. Once again, the CPI described the effects of a supply and commodity shock, while bond markets and credit conditions pointed toward deficient demand and growing macroeconomic slack. After Lehman Brothers and AIG, the supposed inflation threat disappeared.
These episodes don’t say that every increase in consumer prices is irrelevant. They demonstrate that high prices caused by energy, shortages, or temporary buying behavior don’t become sustained inflation. Tunnel vision surrounding oil prices is a mistake, one that we’ve seen many times before with similar results starting with rate volatility.
The two-year yield’s rise to 4.85% is substantial, but it is not unusual for a transition point. The short end is being forced to account for an increasingly hawkish Federal Reserve at the same time the rest of the bond market remains skeptical of the economic justification for that hawkishness.
September’s PMIs supplied the immediate catalyst. Yet the same data that produced the alarming headlines also undermine the boom interpretation. Backlogs jumped, supplier delivery times lengthened, inventories increased, and input costs rose faster than firms could pass them to customers. Similar, though less dramatic, patterns appeared in Europe. This was not simply more demand. It was demand arriving suddenly, almost all at once, because businesses fear higher prices and unavailable supplies.
Such bursts can be powerful, but their strength says little or nothing about their duration. On the contrary, panic buying brings future demand into the present and creates the conditions for a later slowdown. The global nature of the move reflects a shared energy shock and a synchronized response to it.
The historical parallels are therefore useful. In 2018, the two-year rose sharply as the Fed tightened into a weakening global environment. In 2000, it increased by roughly the same amount as today while officials reacted to oil-driven CPI readings and apparently robust data. In 2008, commodity inflation distracted from a recession already in progress. In all three cases, the market’s skepticism about lasting inflation was eventually vindicated.
None of this provides an exact date for the peak in yields. A flattening 2s10s curve is not a timing instrument because the short end must anticipate the changing interpretations of often irrational bureaucrats. Officials may continue to see inflation in every strong data point, especially when they are determined not to be accused of repeating 2022.
For now, however, TIPS breakevens offer the clearest distinction alongside the flat yield curve. Nominal short rates surged, but inflation expectations did not. The market is not pricing a new inflationary boom. It is pricing the possibility that the Federal Reserve will mistake another temporary scramble for one.