OUR REAL-TIME UST EXPERIMENT
EDU DDA Oct. 8, 2026
Summary: The early-October Treasury rally is consistent with the end of the broad September selloff, the mid-month funding bottleneck, and possibly the reflexive trading pattern surrounding both. A 15-basis-point bull steepening since September 28, bond buying despite sharply higher oil, and growing institutional demand suggest September’s yield acceleration was at least partly technical. At the same time, weak metals, distressed credit, a stronger countercyclical dollar, and India’s falling rupee point toward rising economic and financial risk. The theory is working so far, but the message from bonds is increasingly defensive.

We’re watching a financial and monetary experiment unfold in real time and the first results are encouraging, at least for the theory. The Treasury market has begun October by behaving almost exactly we would expect after the end of September. Now, this certain doesn’t prove the theory, particularly with barely more than a week of evidence, but it sure doesn’t disprove it, either.
So far, at least two of those September effects appear to be ending, and perhaps all three. The past two days, in particular, have been instructive. Long-term yields reversed an early yesterday afternoon following the release of the Federal Reserve minutes which confirmed policymakers aren’t planning a protracted Trichet-style hiking campaign.
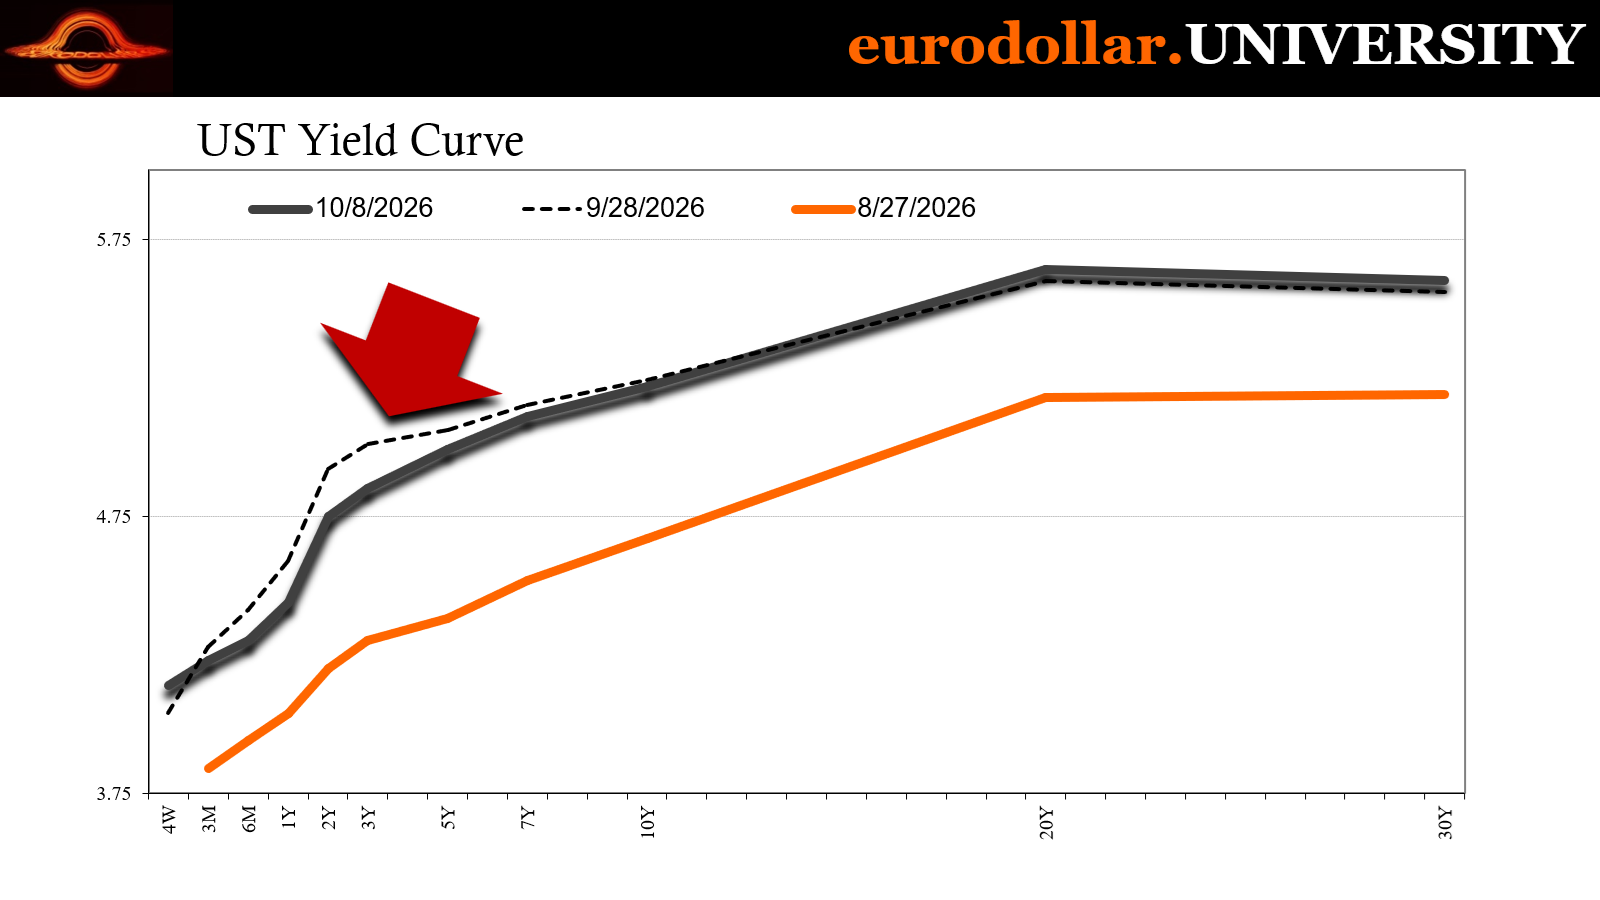
Today’s trading was more compelling. Oil prices jumped almost 4% amid renewed Middle East concerns, yet Treasuries rallied rather than selling off. The two-year yield fell to 4.75%, while the ten-year declined to 5.22%, adding up to a 15-basis-point bull steepening since peak September on September 28.
That change is consistent with TGIO – thank god it’s October – though not necessarily for comforting reasons. Bull steepening led by short-term rates often signals that markets are becoming more concerned about economic weakness and financial risk. Institutional bond investors are also turning bullish just as industrial commodities are deteriorating, adding more color to the picture at hand. Copper is struggling despite supply problems, while iron ore has fallen to a four-year low.
Then there is the dollar. It continues to strengthen even as Treasury yields decline, exposing the limits of the usual interest-rate explanation. India, for example, just raised policy rates and previously had attracted enormous dollar inflows, yet the rupee is once again sitting just barely above its record low.
It puts the Treasury rally, commodity weakness, and India’s eurodollar warning into different parts of the same possibly emerging, increasingly cautious, global story.
Three Septembers and their October test
The first September effect is the broadest: the recurring tendency for Treasury yields to rise from late August through September and, in some years, into early October. The economic explanation changes from one year to the next — higher inflation, excessive Treasury issuance, stronger growth, or a more hawkish Federal Reserve — but the calendar pattern has been remarkably persistent (last year notwithstanding). Long-term yields rise even when the underlying macroeconomic data don’t entirely justify the move, then frequently stabilize or reverse once the seasonal window passes.
The second effect occurs inside the first. Around the middle of September, settlement demands, collateral distribution, dealer balance-sheet constraints, and repo-market friction create a recurring bottleneck. This year, combined repo fails again exceeded $320 billion. That wasn’t a 2019-style emergency, but it indicated that collateral and settlement elasticity deteriorated at the same point on the calendar.
That friction likely spills over into leveraged Treasury (basis) trades which depend on dependable short-term funding, our third September. If repo becomes less available or more expensive, hedge funds may reduce cash-futures basis trades and other relative-value positions. Unwinding those trades can require selling cash Treasuries, or just prevent them from buying as much as a stable market would require, producing an acceleration in yields immediately after the bottleneck.

Part of the effect on the market might also develop around reflexive speculation. Once traders recognize that long-term yields have tended to rise from August into October, they can anticipate the pattern, sell ahead of it, and thereby help create it. The same participants may then wait for an October “all clear” before trading in the opposite direction. With 2025 the exception, the pattern has definitely been consistent enough to attract such speculative attention.
October therefore provides a natural, if imperfect, test. If yields stop rising after the funding bottleneck and seasonal selling window have passed, some portion of September’s acceleration was almost certainly due to these technical matters. The evidence can’t neatly separate repo friction, portfolio positioning, issuance, macro expectations, and pattern recognition. Still, the market’s early-October behavior is indeed what the theory predicted.
It shifts the interpretation of why rates had accelerated upward, at the very least. I still believe Trichet risk played a big role, but as far as the noticeable speeding-up in the second half last month, now followed by curiously-time market stability in October, the short run returns on the test are encouraging.
More important bull
The shape of the rally matters more than its absolute size. On September 28, the two-year Treasury yield reached its recent peak of 4.92%, while the ten-year finished around 5.24%. The 2s10s spread was therefore approximately 32 basis points.
As of today’s close, the 2s have fallen back 17 basis points to 4.75%, while the 10s had declined slightly to 5.22%. (even if rising more in between). The spread widened to about 47 basis points — a 15-basis-point steepening led overwhelmingly by the front end.
Other short-term rates have behaved similarly. That makes this a bull steepener rather than a growth-driven bear. Yields are falling, but shorter maturities are falling faster because markets are starting to moderate the Trichet and potentially recalibrate after the technical September mechanics fade.
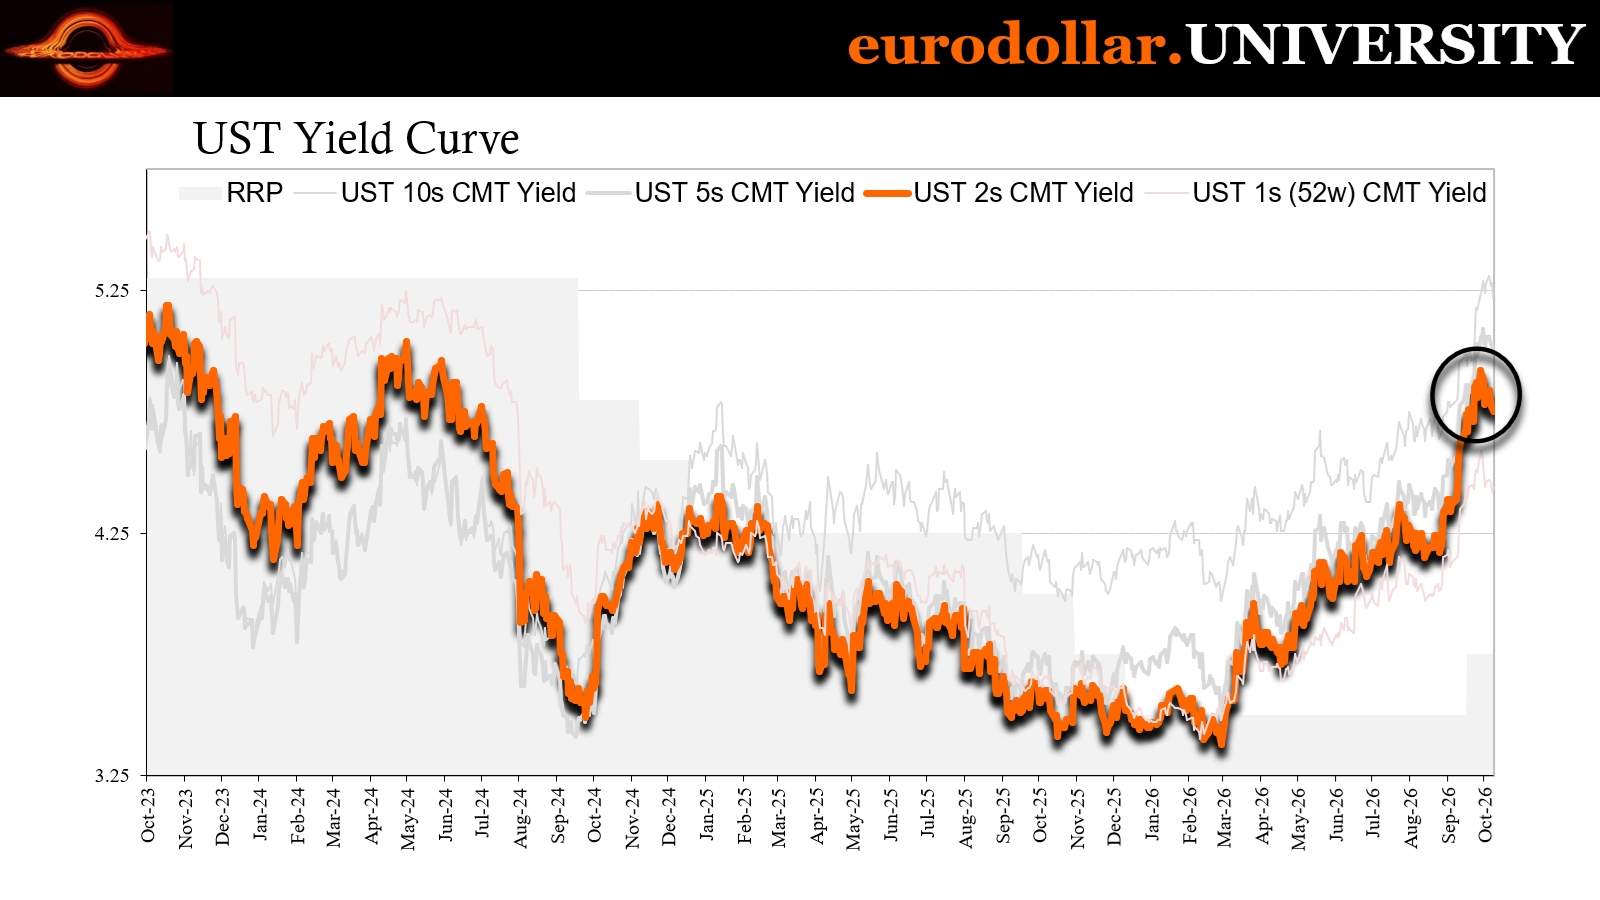
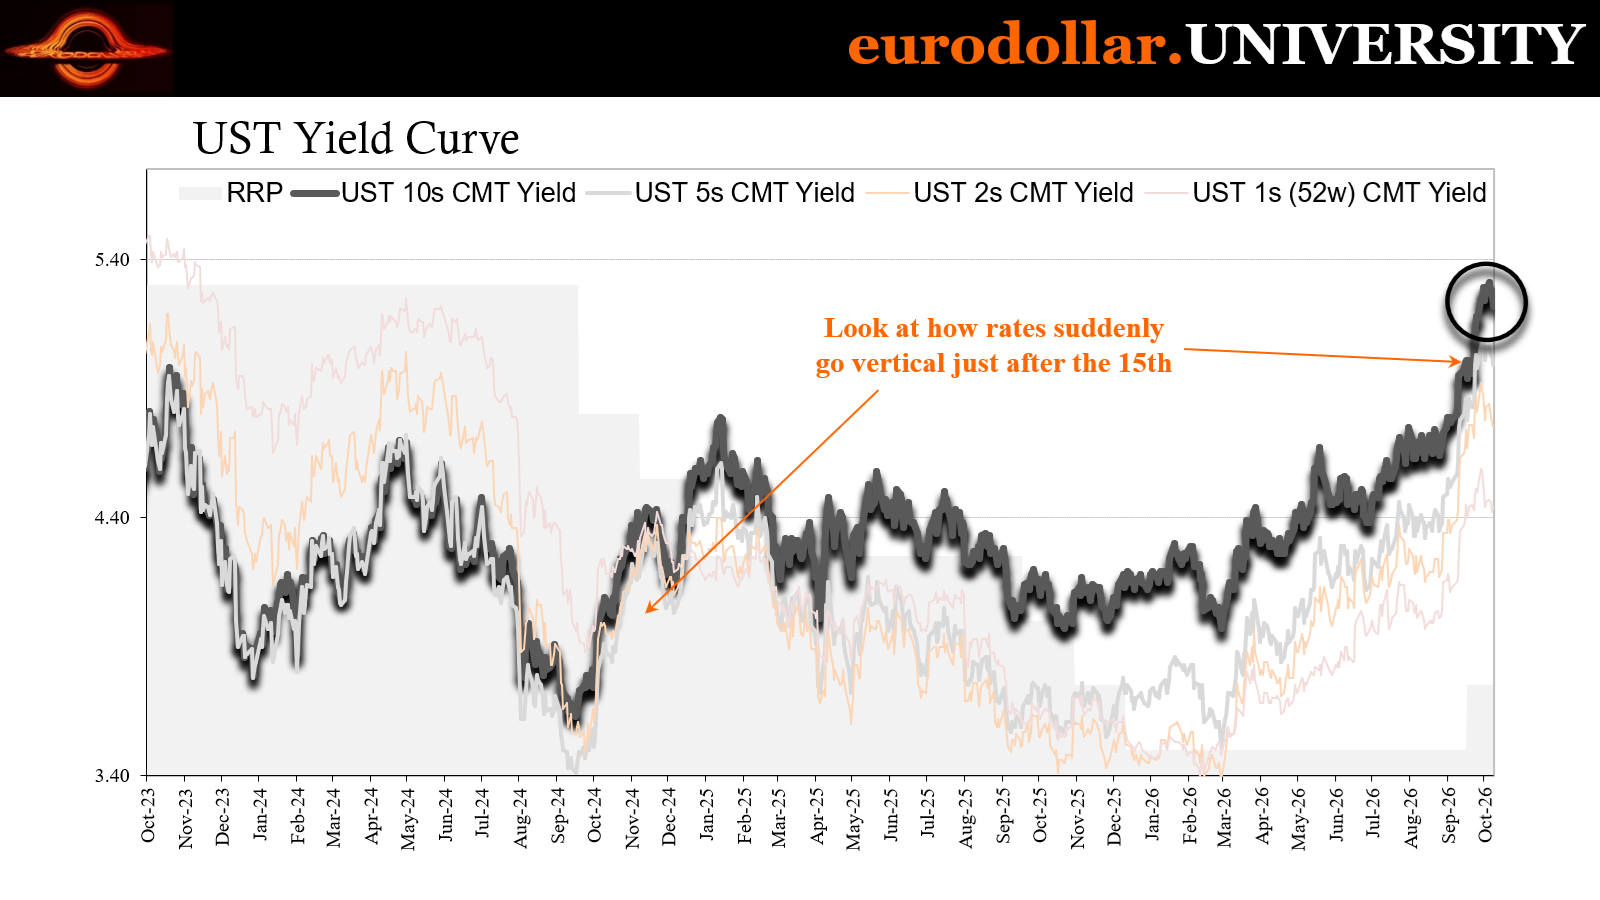
Yesterday’s session offered an initial clue. Long-term yields rose by roughly 5 basis points during the morning before reversing and closing down on the day. Some of that turnaround was likely connected to the Federal Open Market Committee minutes, which confirmed the less aggressive implications of September’s statement and press conference. The minutes didn’t eliminate the possibility of additional Trichet-ing, but neither did they describe an extended series of hikes.
Today gave us a more pronounced result. Crude oil and gasoline rose sharply as renewed Middle East tensions increased concerns about supply. During September, that combination would probably have been used to justify another sharp rise in yields, especially at the front of the curve: higher oil, more short run CPI, and therefore more probable central-bank reaction.
Instead, investors bought Treasuries. WTI rose almost 4%, yet both 2s and 10s yields declined.
That reaction suggests the market is beginning to look through the immediate inflationary effect of oil and toward its negative economic consequences, on top of further establishing a post-September reconnection.
It’s consistent with TGIO - and also why the rally isn’t necessarily good news.
Beginning to trade the other side
Seasonality becomes more influential when investors know about it. If traders expected September’s familiar selloff, some likely reduced duration before or during the month. Once the seasonal window passed without a broader inflationary breakout, those investors had reason to restore their positions.
At much better and more profitable entry points.
Institutional behavior is beginning to reflect that shift. Strategists at several large financial firms are trying to identify a peak in yields, while Morgan Stanley Investment Management’s Vishal Khanduja has turned bullish on US debt for the first time in a decade. The Eaton Vance Total Return Bond Fund, which he co-manages, increased its duration to 6.07 years, compared with 5.8 years for its Bloomberg US Aggregate Bond Index benchmark.
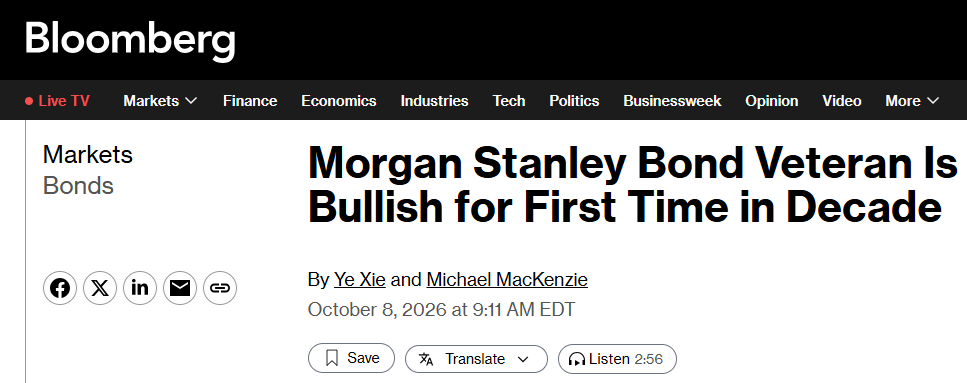
Khanduja still allows for an overshoot of another 10 to 15 basis points. But at current yields, bond math is increasingly attractive since an investor buying ten-year Treasuries around present levels would need the yield to rise toward 6% over the next year before price losses erased the income earned.
That doesn’t guarantee a rally; none of this does. It does change the asymmetry, however. While everyone was all talk about bond vigilantes and exploding rates during the September selloff, the conversation has interestingly shifted alongside both the calendar and the market behavior.
The end of September so far seems a spark in that catalyst. If institutions decide the technical selling has run its course, every temporary yield spike becomes an opportunity to add duration. The October 7 intraday reversal may be an early example: yields rose, buyers appeared, and the move failed. The next day, even an oil shock couldn’t restore September’s selling psychology.
Just a week, so FYI.
Commodities are our real economy check
The Treasury rally becomes more meaningful when compared with industrial commodities. Copper prices are struggling despite additional supply disruptions that would ordinarily support the market.
Iron ore is sending an even clearer warning. Prices fell to roughly $90.98 per metric ton, reaching (by my reckoning) a four-year low. China’s manufacturing PMI remains close to contraction, its property sector is still depressed (to put it charitably), and infrastructure demand hasn’t been strong enough to absorb available material. Chinese port inventories remain elevated near 166 million tons, while additional production from Australia, Brazil, and projects such as Guinea’s Simandou development adds to supply pressure.
Supply explains part of iron ore’s decline, sure, but it doesn’t eliminate the macroeconomic signal. Far from it. A healthy global industrial cycle would normally absorb more of that material. Instead, inventories are high, construction is down, and prices continue to sink.
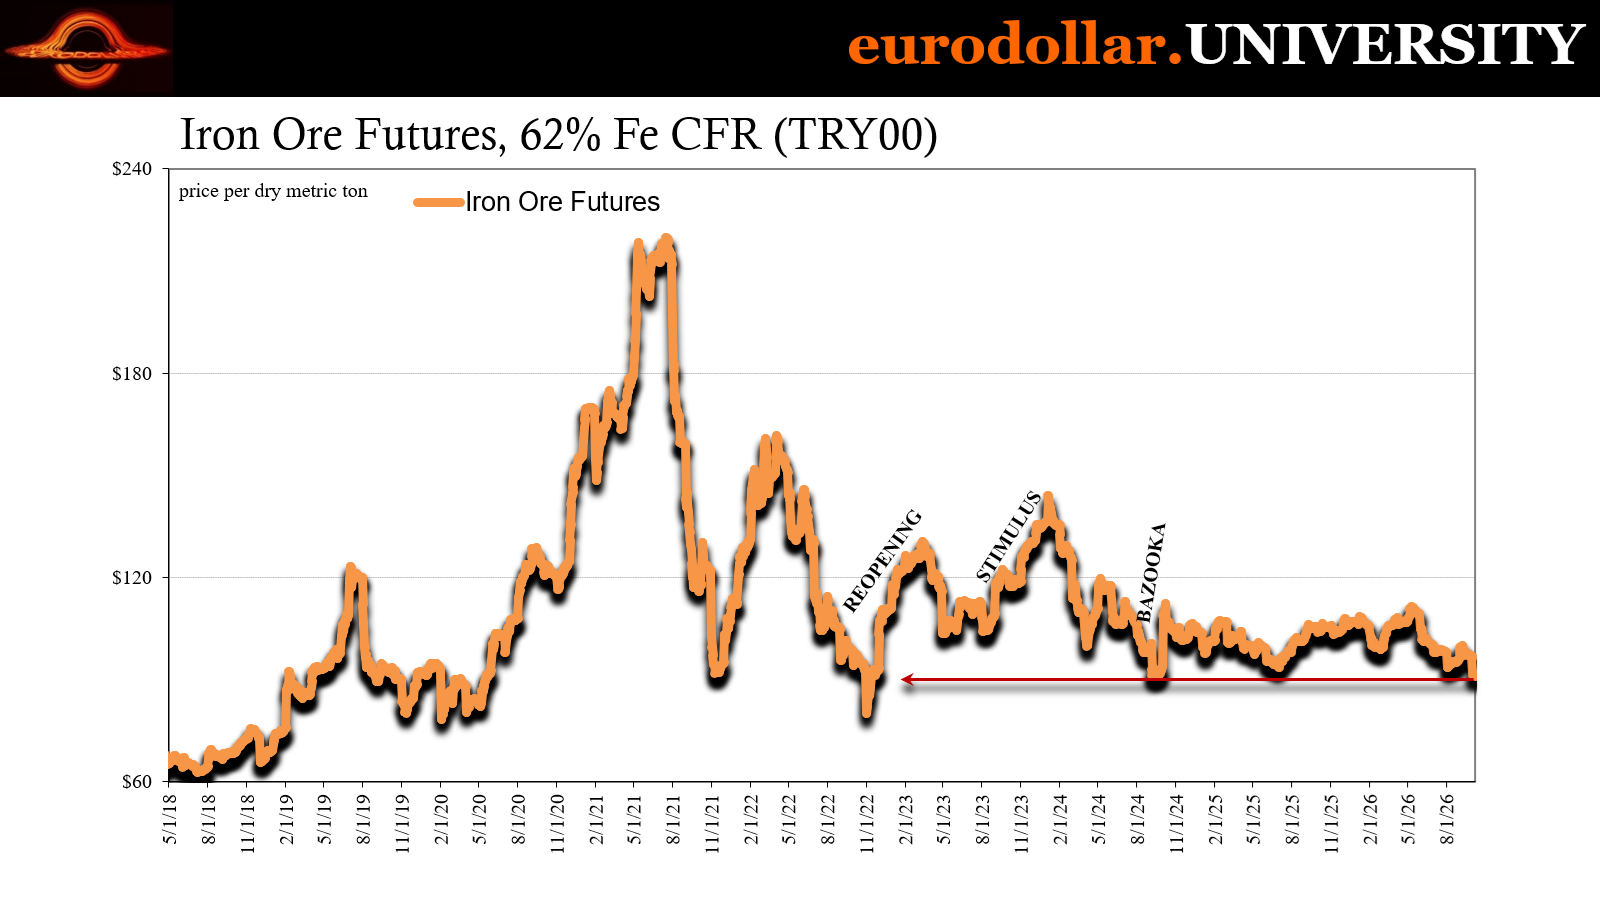
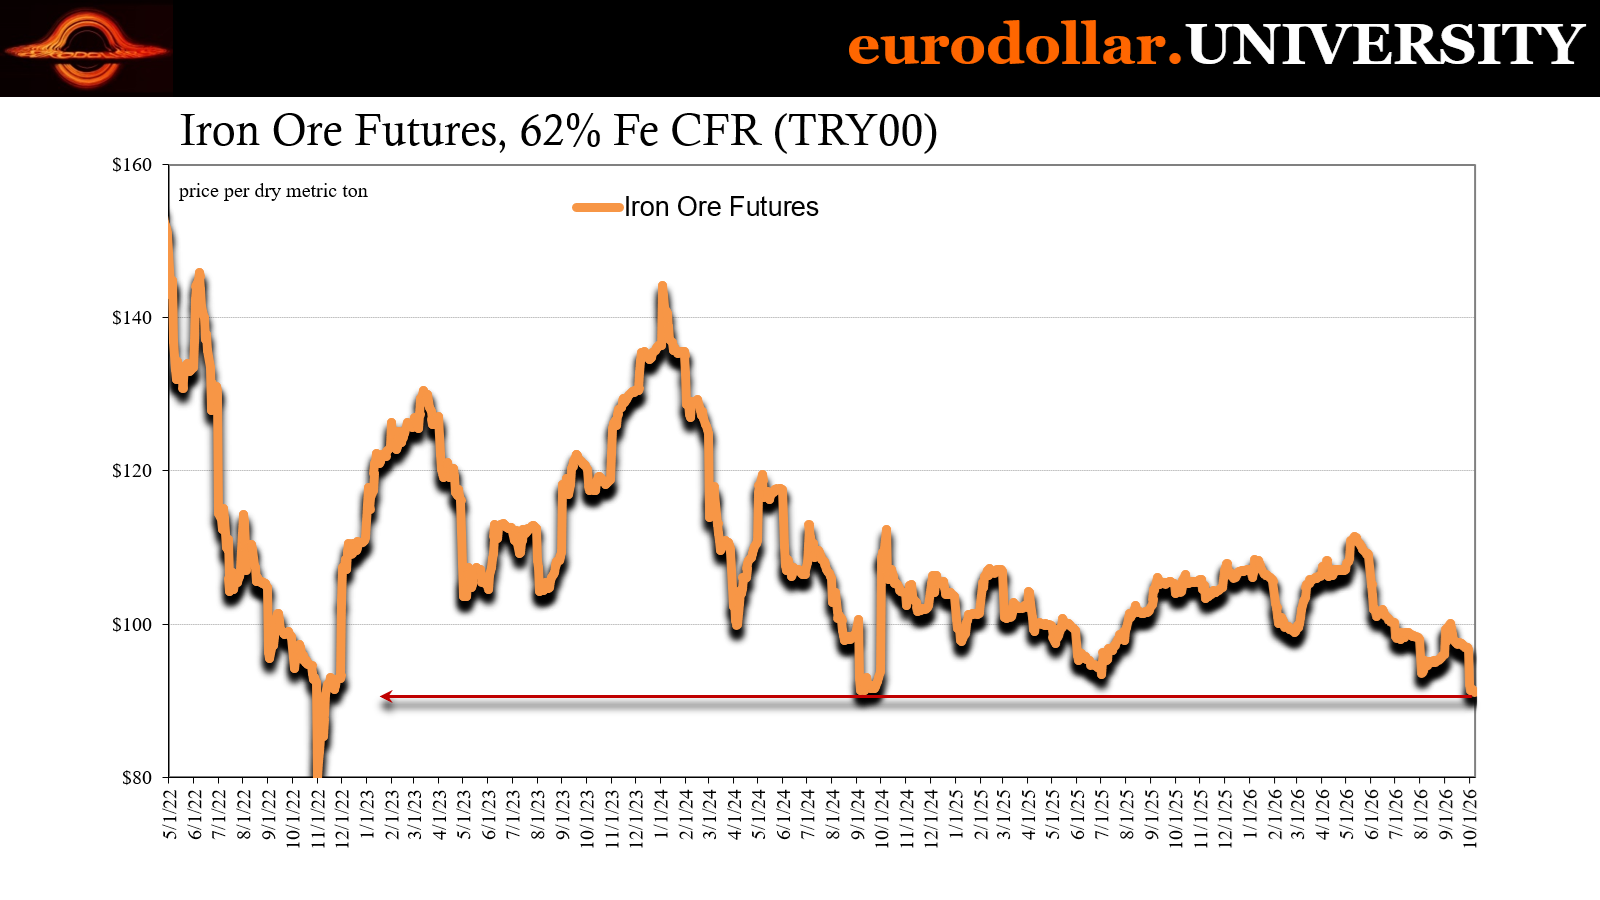
The initial iron ore selloff in early June may have been intensified by liquidations connected to Radiant World and the alleged use of false invoices in commodity-trade financing. Yet the causality may work in both directions. Alleged fraud can trigger liquidation, but a deteriorating market can also expose financing arrangements (by forcing previously incurious lenders to take a real look at what they’ve been lending into) that appeared stable while prices and turnover were rising.
The cockroach becomes visible because the cycle has already started to turn.
None of these developments alone establishes a generalized liquidation. Together, however, they describe a global economy in which is perceived populated by weaker borrowers, leaving commodity traders, property developers, and refinancing-dependent companies less room to push for reflationary trading.
The Treasury curve may now be recognizing what industrial commodities (and the weakest parts of credit) have been saying for some time.
India’s enduring eurodollar warning
The dollar adds another dimension because it is “strengthening” even as Treasury yields decline. Mainstream analysis usually connects currency movements to interest-rate differentials: higher US rates attract capital, while falling US rates should weaken the dollar. Especially if there is any chance to make that about the Fed.
That mechanism sometimes matters, the market part, but it can’t explain the current behavior.
The dollar is acting countercyclically. Higher oil prices and Middle East tensions have increased demand for safety, not to mention urgent funding, while importers require more dollars to pay for energy. Those commercial and financial requirements strengthen the currency regardless of what US yields do.
India is the clearest example. The Reserve Bank of India spent months encouraging banks to attract foreign-currency deposits, including deposits from non-resident Indians. The broader campaign helped generate more than $140 billion inflows which was supposed to at least stabilize the rupee, if not create a durable countermovement.
India attracted the foreign money, created an enormous rupee surplus, and then had to use dollars to remove some of those rupees. Despite all of that, the currency continued weakening anyway.
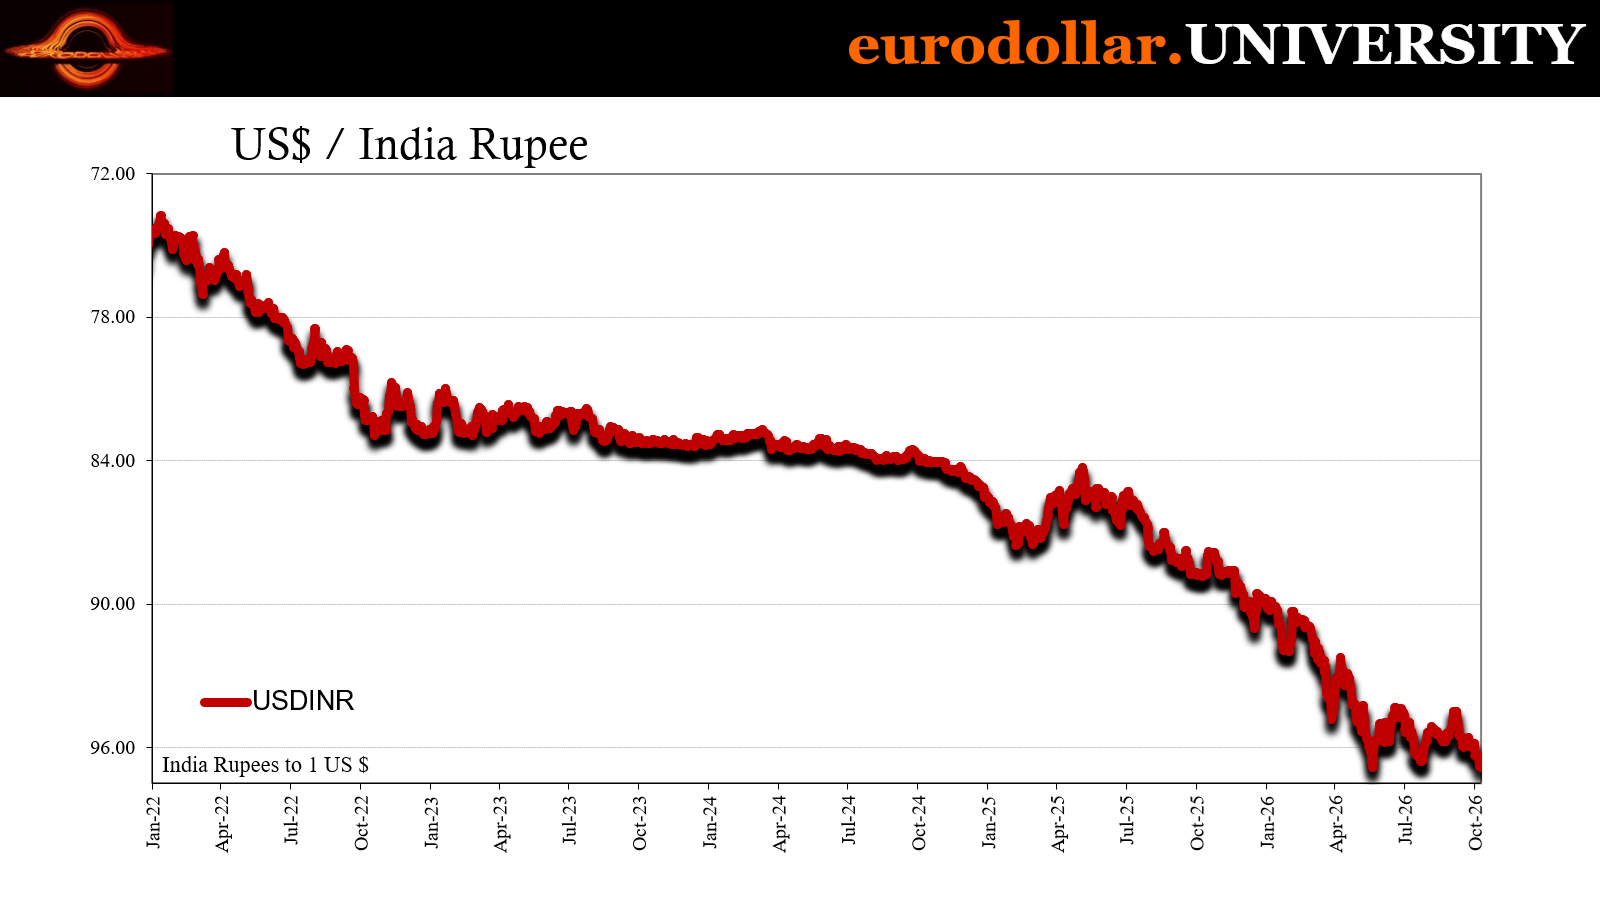
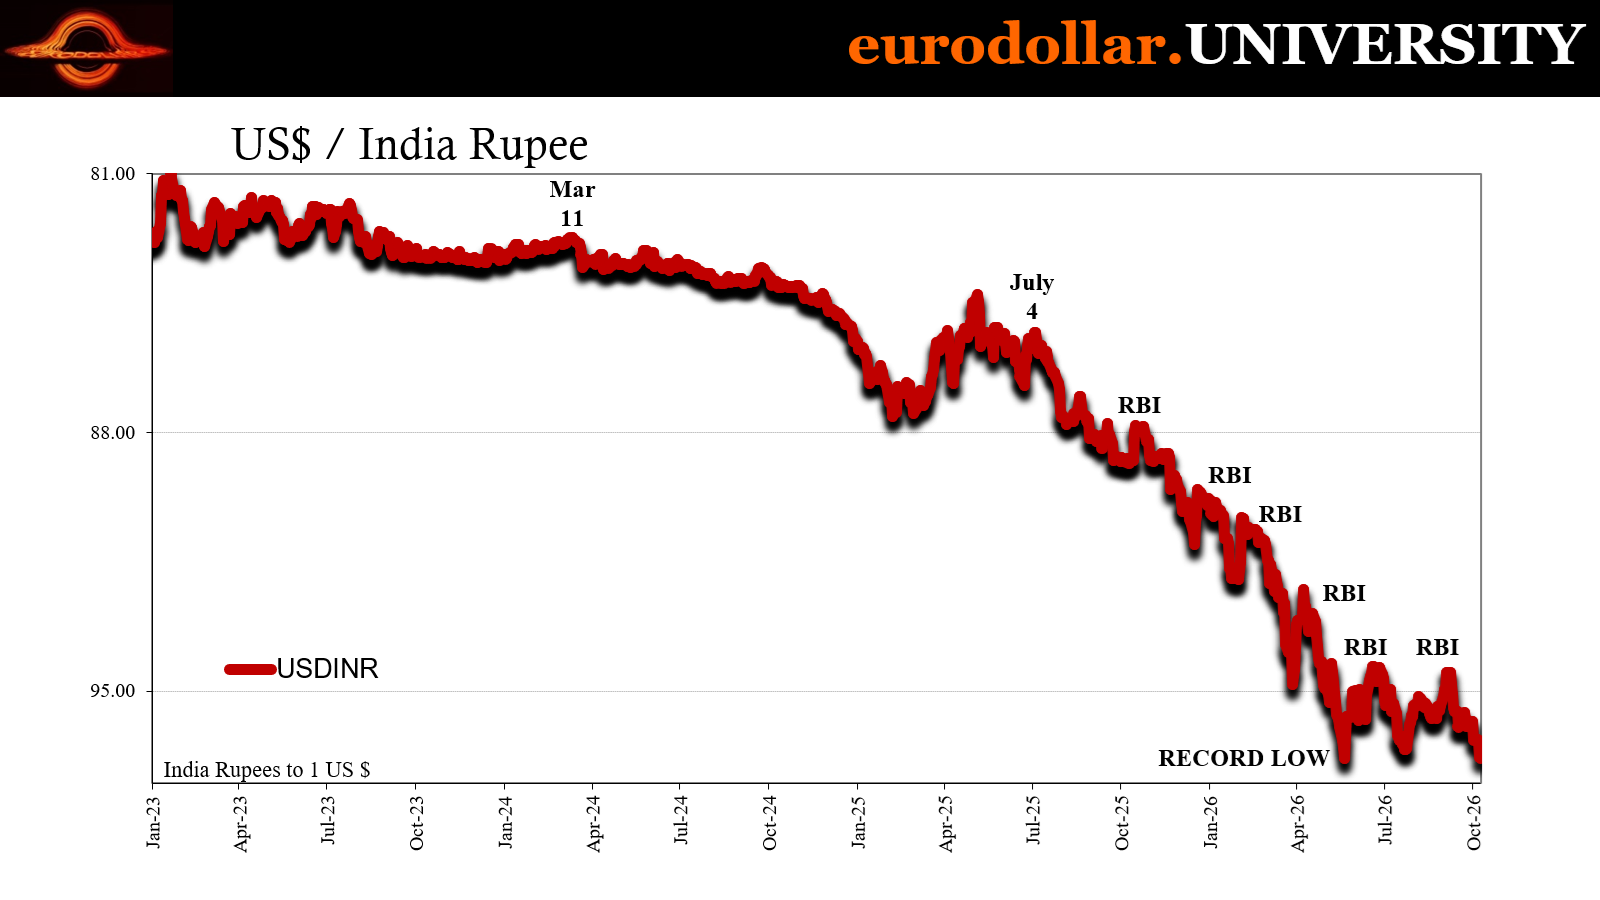
Yesterday, RBI raised its benchmark repo rate by 25 basis points to 5.50%, its first increase in almost four years. Policymakers also shifted toward more hikes, though officials are playing it like the Fed. Yet the rupee, already down about 7% this year, remains within a whisker of its record low as of right now.
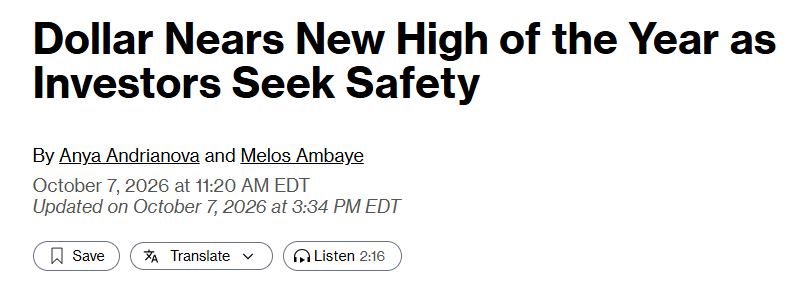
I’M AS SURPRISED AS YOU THEY ACTUALLY GOT IT RIGHT AND DIDN’T JUST SAY ‘FED’
The apparent contradiction disappears once capital inflows are distinguished from underlying dollar requirements. India imports most of its oil, and those purchases are predominantly priced and financed in dollars. Higher energy prices increase the commercial demand for dollars regardless of how many foreign deposits Indian banks attract. A deposit program can temporarily supplement funding or reserves, but it can’t eliminate the economy’s structural dollar shortfall.
Even something like those inflows is really all for show, another symbolic measure meant to “wow” speculators and force them to reconsider their ill-gotten ways. But India’s currency problem is not speculation, nor speculative.
This is why the country and the rupee have functioned as a eurodollar canary since October 2007. When global dollar conditions become less elastic, India often reveals the pressure early. The rupee’s weakness despite massive inflows, constant intervention, and higher rates is therefore more than a local currency story.
It indicates that the global system’s demand for dollars is outrunning the commercial supply available on acceptable terms. Something bulls on bonds would trade.
It remains way too early to declare that Treasury yields have peaked or that September’s selloff was in large part technical. The October sample is tiny, and yields could still overshoot as markets process oil prices, incoming information, and how the always-irrational bureaucrats at the Federal Reserve will interpret everything (knowing these windows of semi-rational takes typically don’t last long). Counterfactuals are especially difficult: there is no way to observe where yields would have traded without seasonal positioning or repo friction.
Still, the early results are consistent with the experiment. The broad September selling window has passed. The post-bottleneck acceleration has ended. Traders may also be receiving the “all clear” to reverse positions established in anticipation of those patterns.
More important, the market’s reaction function has changed. An almost 4% increase in WTI failed to push Treasury yields higher. Institutional investors are adding duration and treating yield increases as opportunities rather than warnings to pile on more shorts.
The surrounding evidence supports that shift. Copper is struggling despite supply problems. Iron ore is at a four-year low. Weak credit continues to show strain. The dollar is rising as a countercyclical safe haven, and even the media is picking up on that, while India’s rupee remains near a record low despite enormous inflows, intervention, and a rate increase.
September may have exaggerated the level of Treasury yields. October is beginning to remove that distortion. But if TGIO is taking hold, the emerging bond rally isn’t announcing that everything is fine. It is indicating that expensive energy, dollar scarcity, and accumulated financial pressure are becoming more prominent again for the system to keep ignoring.