SWAPS AND GOLD BACK BAD DEALER BILLS
EDU DDA Jun. 30, 2025
Summary: The end of the first quarter saw a mess of triggered deflation. While the conclusion of the second doesn’t have that, not right at this minute anyway, it isn’t anywhere close to enough different. The 4w bill is misbehaving and we’re seeing dealers take a particular interest in those and similar instruments. We also have swap spreads and the metal ratio scraping along at basically the same levels as April. The background context for the monetary and financial world at the start of 2025’s second half hasn’t changed much at all.
SOMETHING IS GOING ON.
It certainly was an eventful first half of 2025. As the second is set to begin, while stocks are soaring as if whatever might have been wrong during the first six months has been successfully handled, it is decidedly not the case anywhere else fundamentals matter. Swaps, ratios, even collateral, not to mention the real economy, as we went over on Friday.
First, the 4-week bill is still presenting a more immediate puzzle, so we’ll start there. It had seen its equivalent and auction yields plunge last week, now begins this one with a sharp rise. This doesn’t argue against any potential collateral bid in what happened a week ago, rather strengthens it. We’ll check in on repo fails and dealer Treasury holdings – particularly bills – to see what those indicate as far as blackhole mechanics.
There is some there there.
Second, swap spreads, the Big Ones. Rather than price in some kind of even modest re-risking let alone some path into reflation as seen from the NASDAQ or S&P 500, swaps have barely budged an entire quarter since their deflation-confirming crash. Swaps aren’t just coming in for the bull steepening, they’re beyond merely encouraging it.
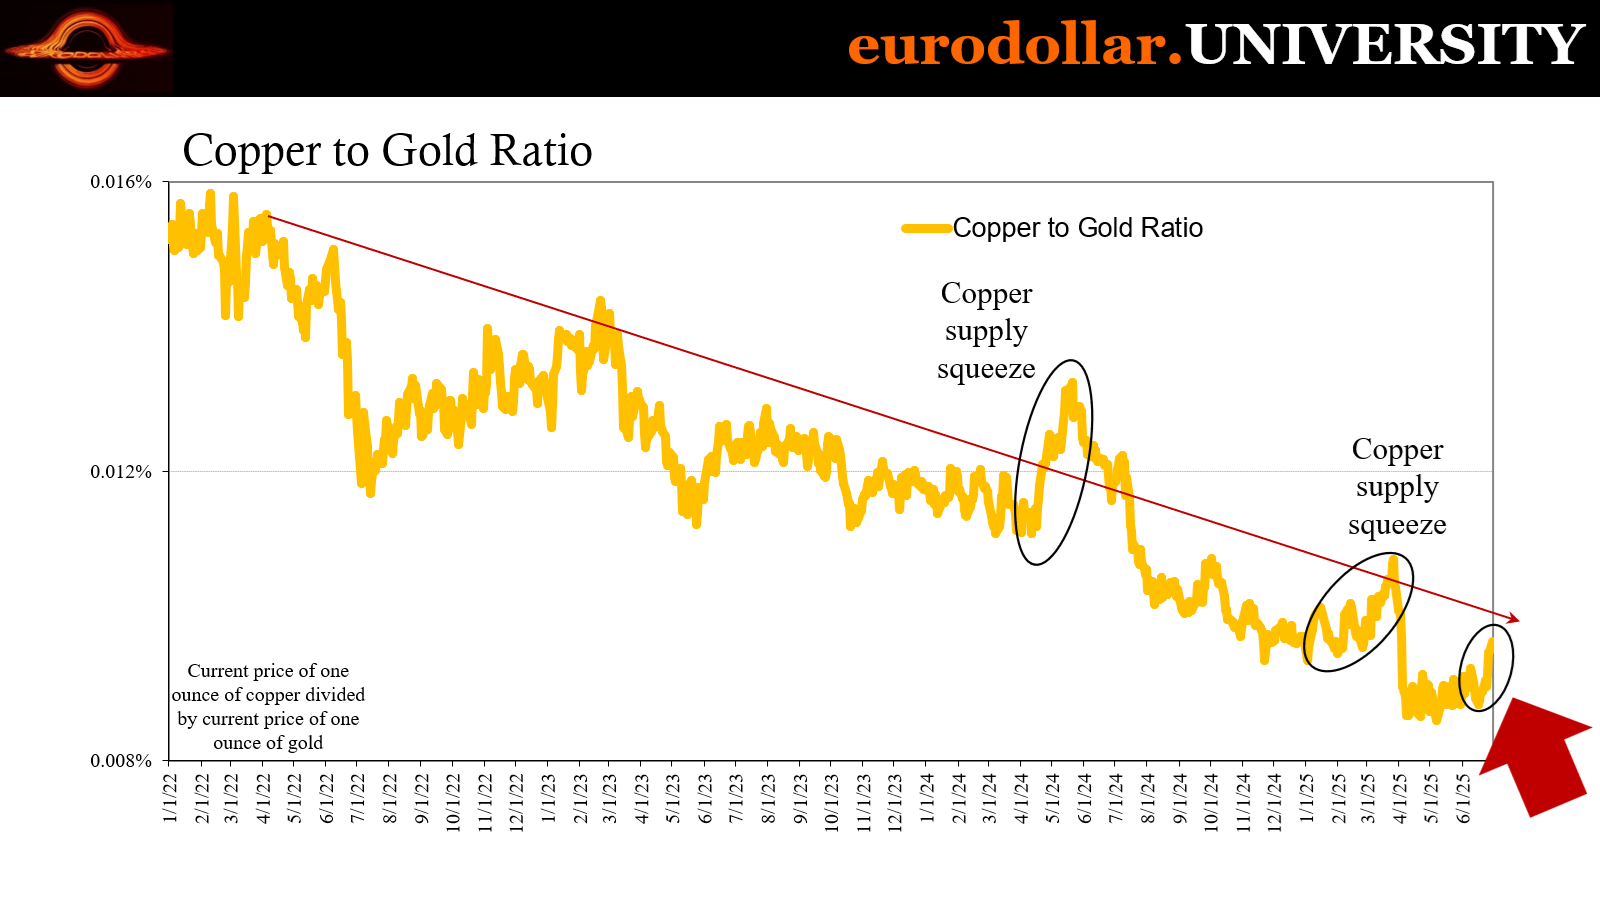
Finally, the swap market’s stubbornly negative shape has been unsurprisingly duplicated, if to a slightly lesser extent (for other reasons), from corresponding copper-to-gold (CtG). Even with copper north of $5 per pound at the CME and the ratio on an uptick, the metric remains well below where it had been before the monetary outbreak in April.
Those all corroborate the growing pessimism from other indications like the Swiss franc and the negative bond yields over there in Switzerland we’ve covered recently. CHF isn’t “sell America”, it’s the flipside of ultra-low swaps and CtG as both refuse to give up their negatives and lows. And if bills are experiencing collateral favors, those, too.
We do have to (always) keep in mind how none of these are anything close to perfect or one-to-one; there is no IF THIS, THEN THAT with our blackhole numbers. At most, we get IF THIS, THEN MAYBE THAT which means we better check around to see what everything else is doing.
But with the first half of the year in the books, the second half starts out with a whole lot more than tariffs holding it down. That much is for sure given the monetary and financial weight which hasn’t been lost.
What the bill
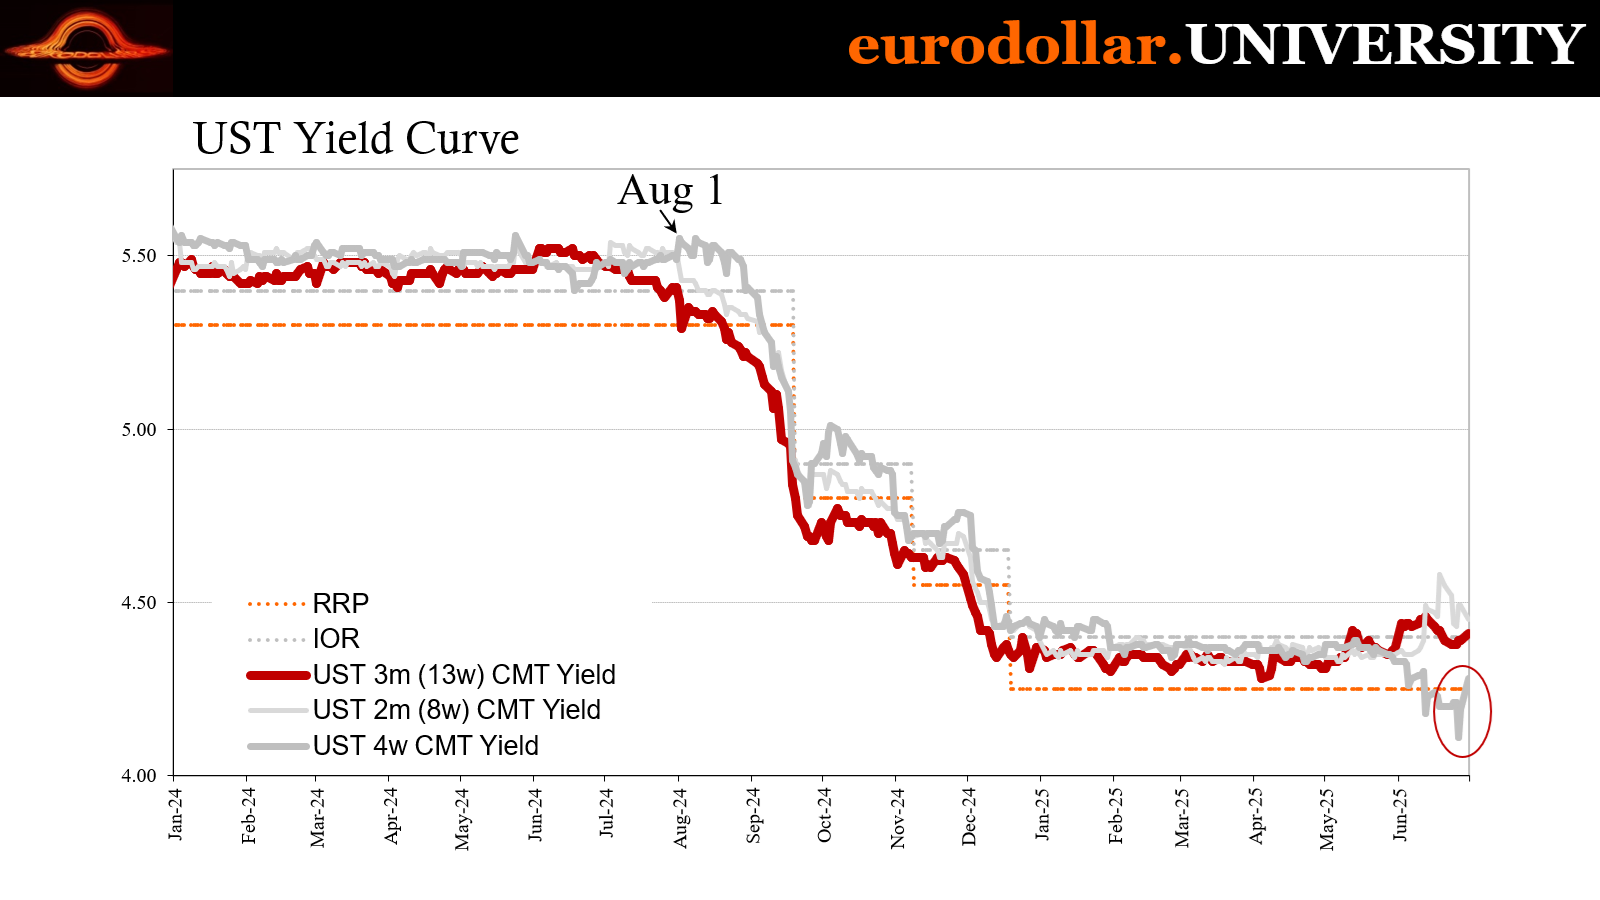
We last left the 4w bill in the middle of last week down around 4.00% (primary) or 4.10% (secondary), both rates well below the RRP and other, higher-yield ST alternatives like repo. The first and maybe most logical explanation was debt ceiling – the 8w bill was being avoided, so it would have been natural and understandable for the avoiders to roll into the 4w.
However, there’s a limit to the avoidance. No MMF manager is going to sacrifice too much yield chasing a debt ceiling figment, not with so many superior (returns) substitutes available. Plain common sense and basic finance suggested the spike down in 4w yields was something more than the simple debt ceiling roll.
Plus, it had happened before, back on June 12 before the 8w bill began its debt ceiling maneuver. And there was another one the week before then, back on June 5 which pulled the 4w rate down to RRP the first time.
This past Friday, the rate began to move higher again, reaching 4.19%. Trading today pushed the yield back above RRP again, all the way to 4.28% - a strong 17-bps retracement in only two days. That isn’t debt ceiling, instead looking more like the other side of a short-run run to top-flight collateral.
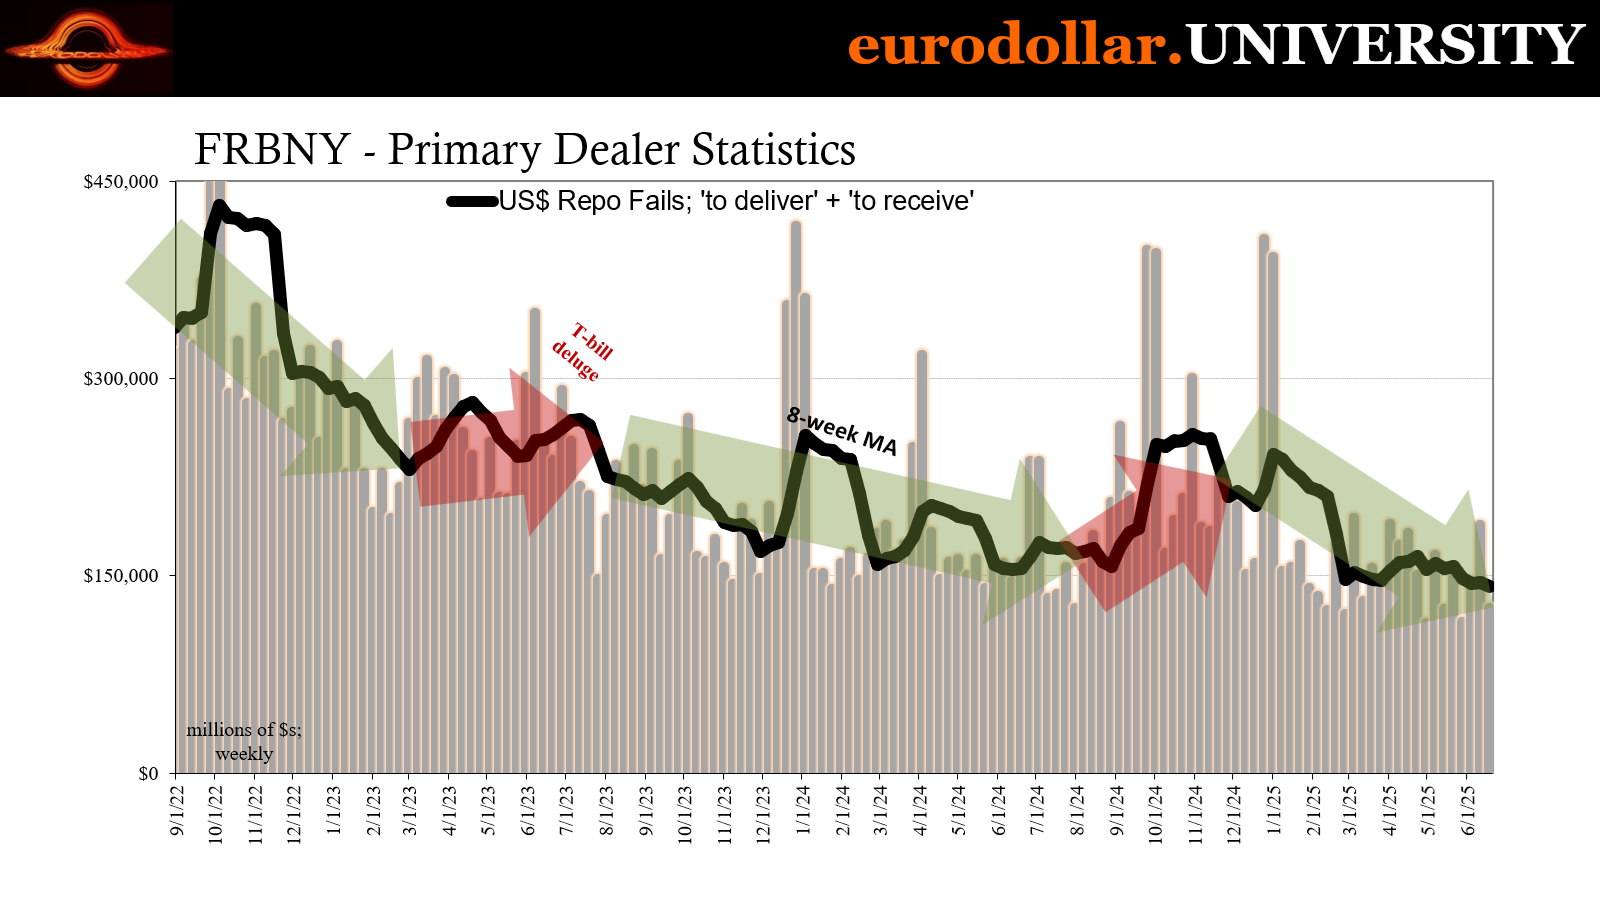
The thing is there isn’t much to suggest any ongoing or even acute repo problems, at least not right at this second. There is one possibility everything here might be related to the quarter-end and window dressing which reduces dealer capacities as they all try to make themselves look less like what they really are. Part of those reduced capabilities relates to collateral circulation, one reason why, for example, we’ll see repo fails rise into quarter-end.
It's possible that the system scrambled to buy up every 4w bill possible before being caught out at the bottleneck, especially with Treasury issuing fewer of them these days.
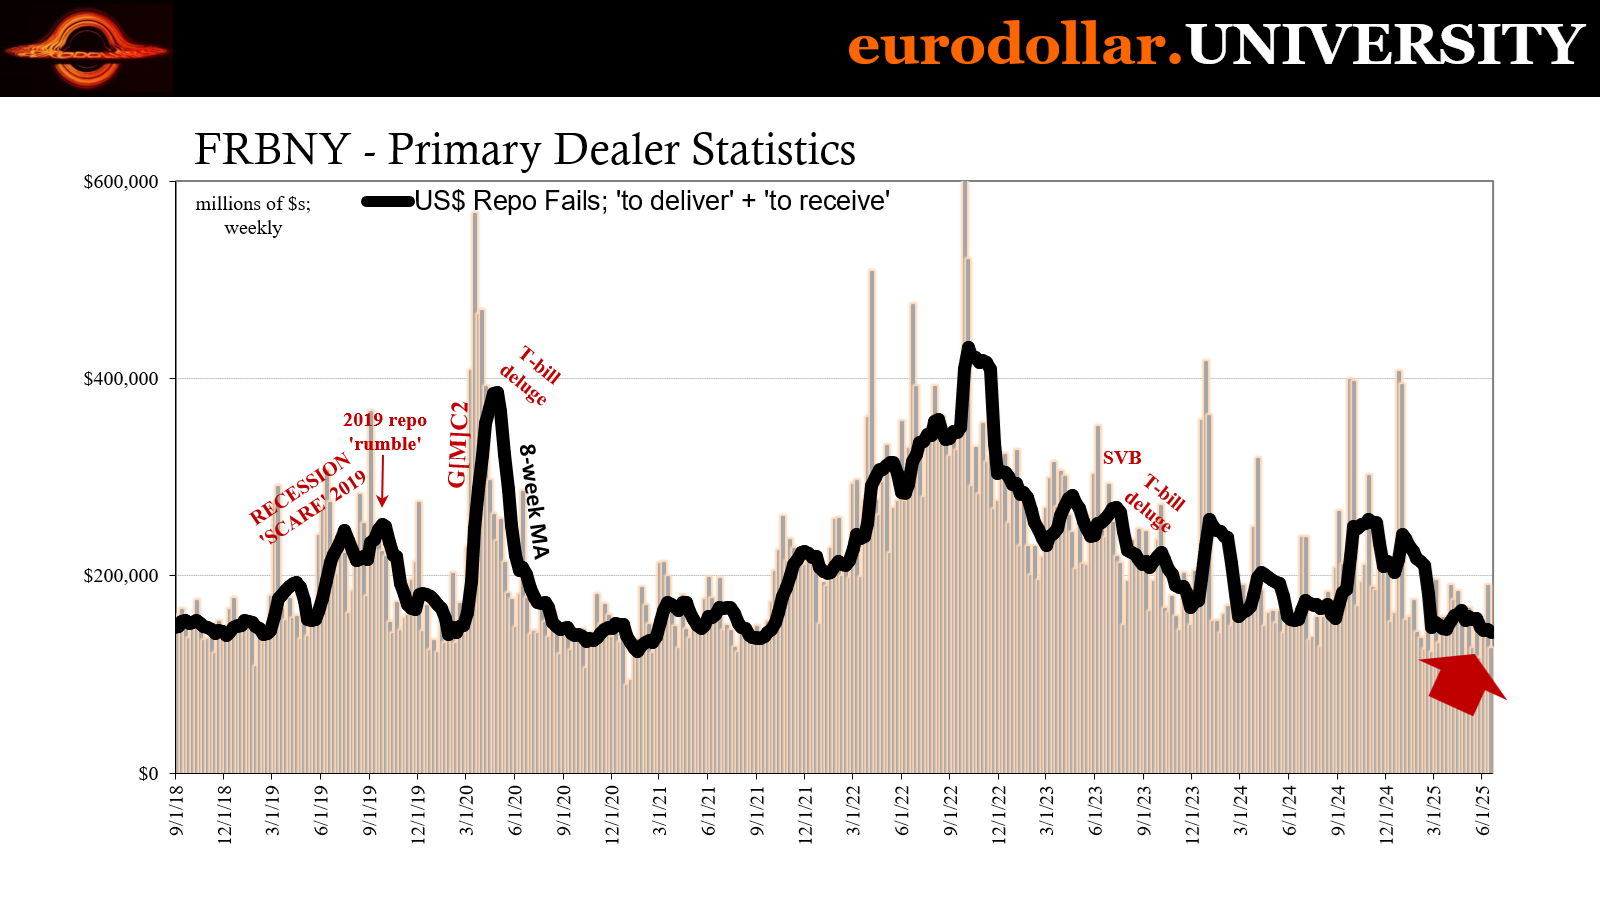
Repo fails themselves have rarely been this benign, so that one doesn’t fit. In fact, fails have slid down to new multi-year lows, on average about where they’d registered back in 2021’s reflationary starting point.
In many ways, then, fails have been taken out of the overall context, which isn’t unusual. During Euro$3, for example, fails had spiked early on then stayed mostly silent during some of the fireworks (like CNY and stocks in August 2015) before making a dramatic reappearance in early 2016.
Bills for bills
On the other end of fails is dealer holdings – coupons and bills. Starting with the former, inventories of notes and bonds had soared from late November right along with the dollar shortage (and currency crises) and foreign Treasury selling to end last year and start this one. Since February, primary dealer hoarding has remained relatively constant at these massively elevated levels; way above even record highs from before November (like last August at the carry trade peak).
They have been pared back ever-so-slightly at the beginning of May, perhaps a touch of re-risking (or less extreme hoarding). Even if that was the case, inventories are on the rise again here more recently. Like fails don’t disprove collateral, dealer holdings of coupons don’t conclusive affirm the potential for disruption, though they are far more in the right frame for collateral difficulties and close to swaps.
The more compelling and concerning datapoint isn’t coupons, it’s bills.

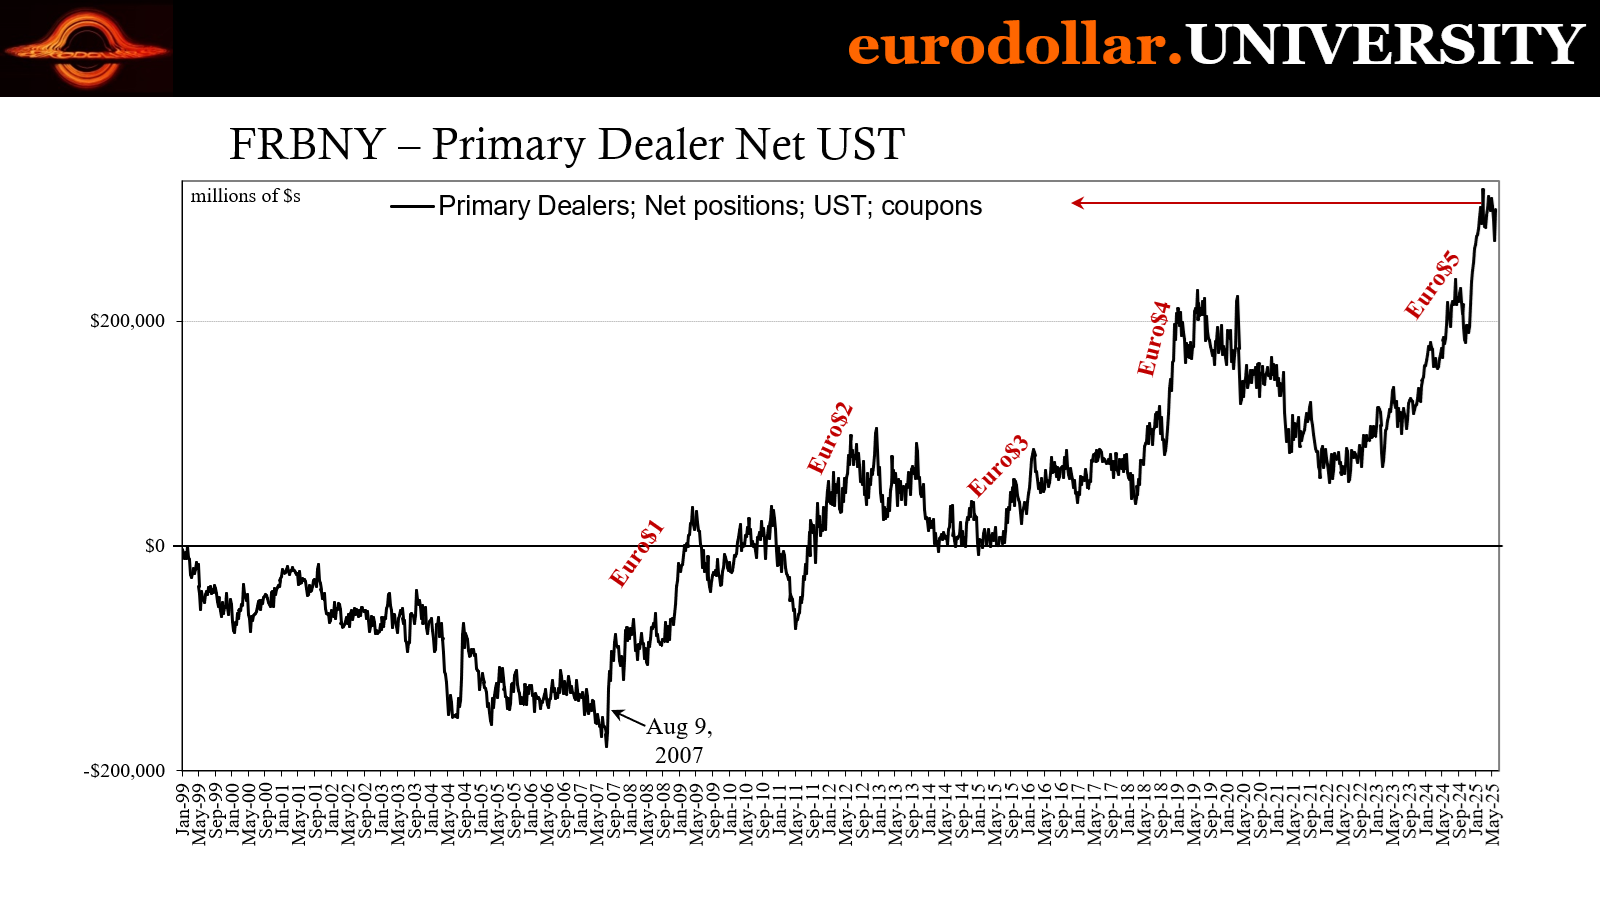
What I mean is, we normally find dealers (including others not strictly primary dealers) will load up on those before major collateral and deflationary outbreaks occur. There was an enormous surge in dealer bills from mid-January to the first week of March 2023, right when the bank crisis was showing up. Then during it, dealers were selling and lending bills (as bill prices soared) meaning they “disappeared” from inventories in large numbers.
Bill holdings rise sharply right before, then get used during. In other words, dealers did exactly what you’d expect them to – sense a profit opportunity from tight collateral and then act.
The same pattern played out last July and August (carry trade reverse, with its heavy collateral presence) all the way to October (Japan reversals kept going until then); then again with a huge increase in dealer bills the final two weeks in November prior to the dollar shortage in early December. Finally, once more the big runup in February that got released back to the system starting right in the first week of April and its more obvious global deflation (and shocking rise in credit spreads).
Over the past few weeks (the week of June 18 is the latest), dealers are starting to stack bills one more time. As of mid-June, that stack had reached $90 billion and right in the area of potential danger.

As noted in the intro, this doesn’t mean something big is happening under the surface, just that thee is a pattern here and the context fits.
Plus, dealer holdings of coupons are still enormous, so there’s that. Their hoard of specifically bills, that does ring some bells for collateral beyond any debt ceiling effect and not for today or the past little while, rather ahead of us in July at the start of Q3.
Definitely have to keep a close eye on bills.
Stubborn bigtime context
One of the most compelling actions by the swap market wasn’t necessarily April’s plunge or the one back in September 2022. Both had more obvious consistency, with open monetary difficulties clearly plaguing the world at both times. Though you do have to give swaps more credit for the latter of those since it happened at a time when rates were the rage – the most hawkish and inflationary mainstream commentary this side of 1990.
And that makes the shift in August 2023 all the more astounding. The compression in spreads was also very clear, yet unlike the year before there was no blatant disorder, simply the aftermath of the previous episode with SVB, Credit Suisse, and First Republic which had, for all intents and purposes, appeared to have completely subsided.
From August to October, however, the swap market was saying prepare for falling rates at probably what was to most people the absolute least likely time for believing that was even possible. Central bankers were still manipulating the short end, constantly in fear of inflation and declaring higher-for-longer as the thing. Let’s not forget “too many Treasuries” at the explosion of government borrowing.
Everything seemed to be against the Treasury market except swaps (and related curve inversions) while nothing appeared to align with them. We know how it turned out.

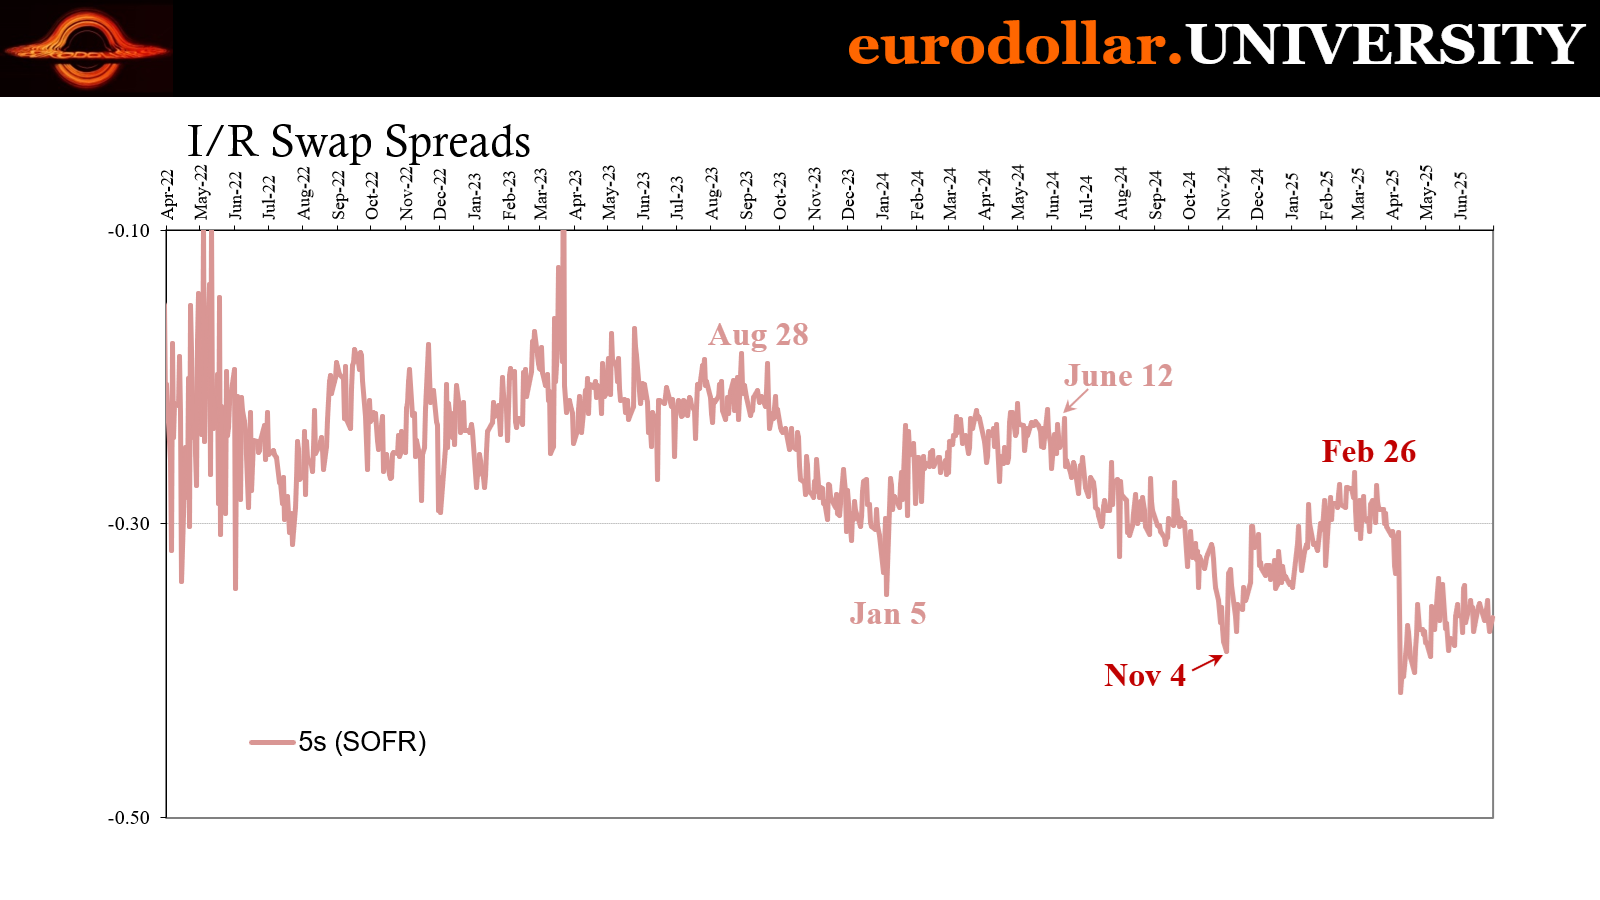
A close second goes to last June, therefore what does appear to be an assist from Christine Lagarde. Swap spreads again clearly depressed even more negative though the mainstream was still enthralled by Powell’s “sticky” CPI confusion. As before, swaps behaved contrary to all those interpretations. And the downturn in spreads was aligned with the coming carry trade scare and recession fears.
The ECB comes in based on the timing for the most obvious downshift in swap spreads. Its policymakers had met on June 4 and 5, surprising some based on Lagarde’s sudden shift in tone – she and her colleagues had been in for Powell’s view before then. Suddenly, Lagarde was talking about how confident the ECB had gotten to be over their models for “inflation.”
The story was nonsense and the market knew it – the ECB began to see more clearly the downside emerging in the economy (like the Swiss had three months prior). They were shifting decisively away from “sticky” which meant ST rates in Europe would be confirming the direction swaps had started taking two years before then. Of course, Powell and the Fed would follow three months later.
These days, swaps spreads are basically where’d they been starting with early April. It’s one of the most concerning of the post-deflation developments (and does give the bill story some serious weight). Rather than retrace, the longer-dated maturities have been nothing more than bouncing along this latest bottom. The most they’ve given for a move has been at the 2s or 5s, and, even then, it was only ever a modest retrace, one that’s already turning over again.
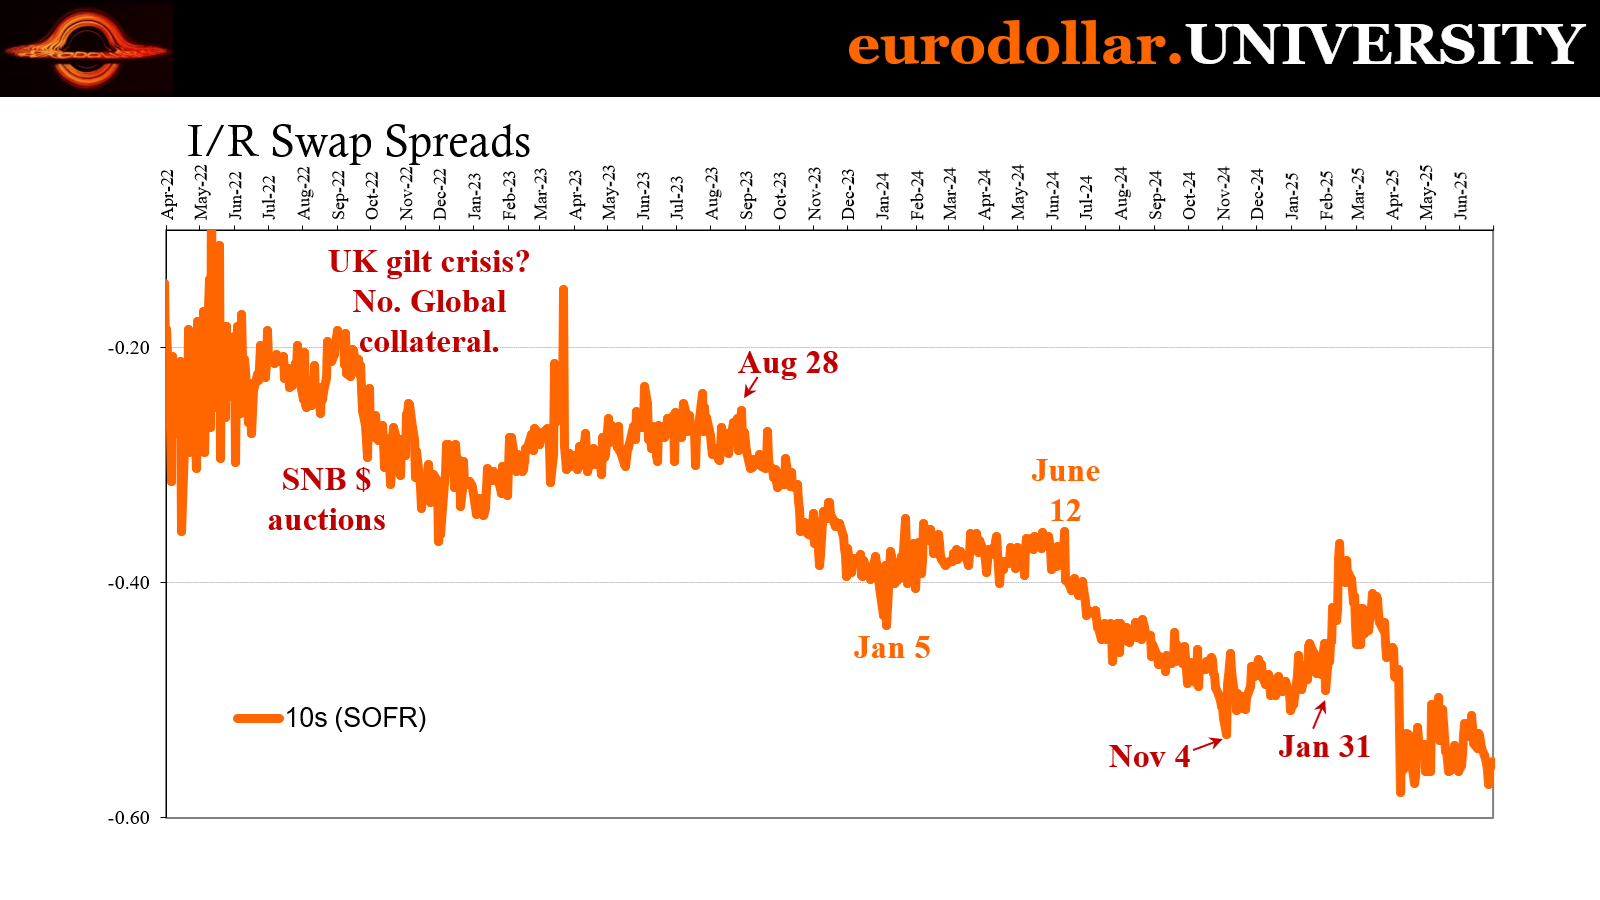
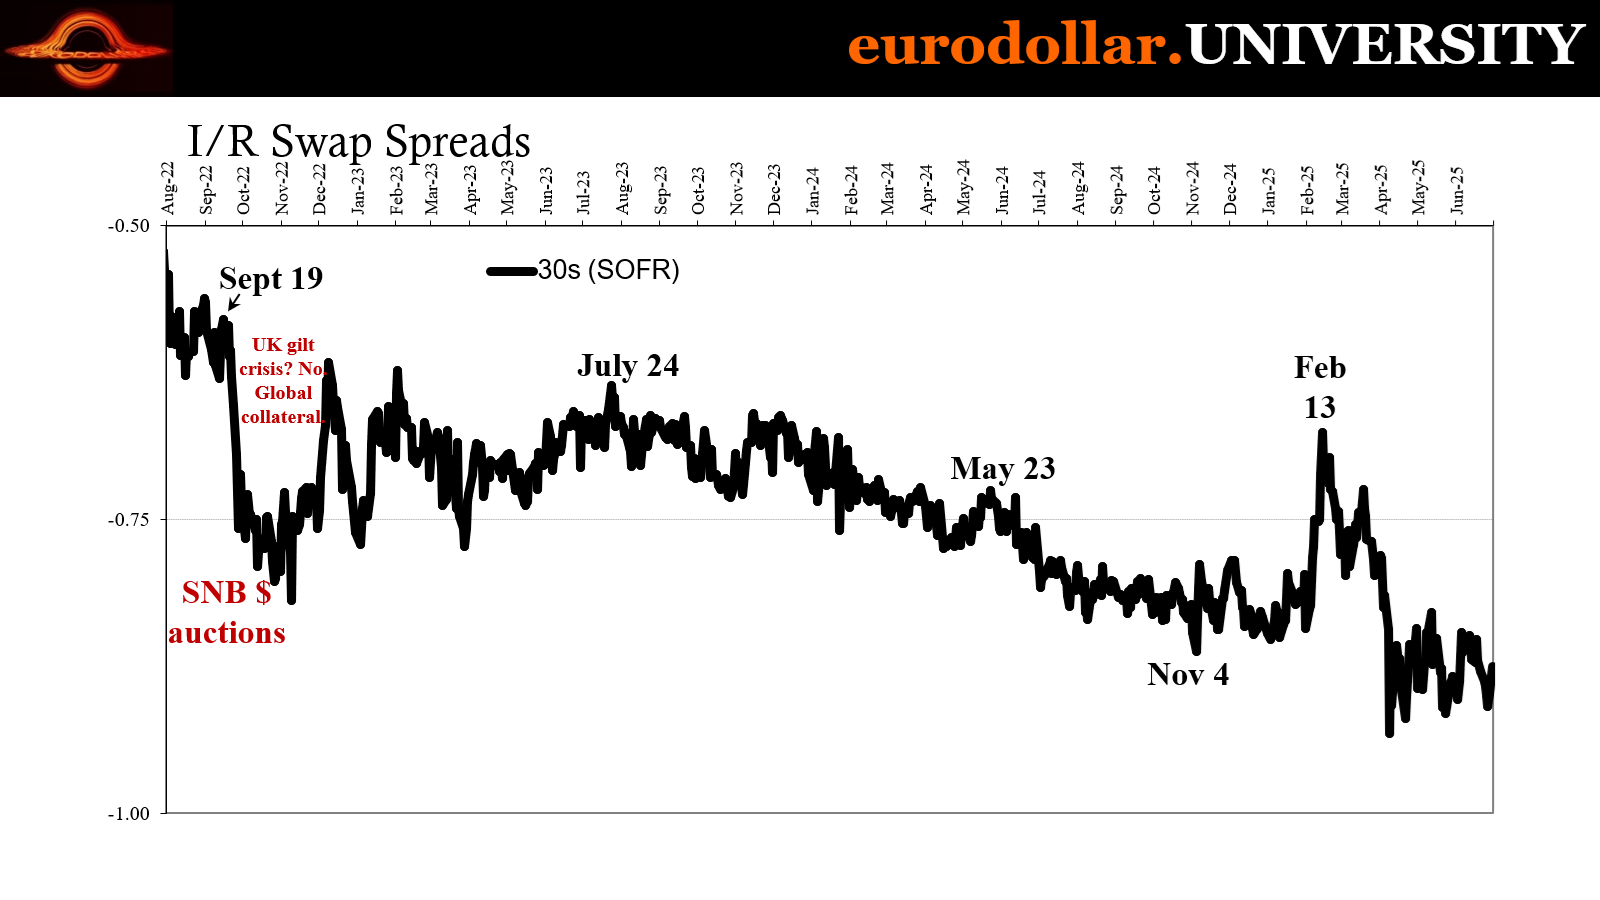
Meanwhile, the 30s looked like they might actually set another record low last Thursday - the same day the 4w bill hit its low. Swap spread 30s dropped under -90 bps, only a few paltry bps from the all-time mark. The 10s were closer, only half a basis point above on the same day. While both maturities backed off Friday and today, it’s the same bottom scraping.
In short, the swap market is still pricing a very high confidence in a lot lower ST rates that stay lower for a very long time.
That’s consistent with collateral difficulties moving forward, the still-high probability for further deflationary outbreaks, what’s got all those global eurodollars moving into negative Swiss bonds. From the macro side, just look at worker incomes and the very clear trend-change in the big one, consumer spending. The world keeps moving into the swap’s long run target range.
Copper tariffs
Gold like swap spreads has been mostly sideways, only right along near its record highs. There has been at most a slight pause in urgent buying, the market exhibiting relatively constant demand and interest anyway.
Copper, on the other hand, has seen its price soar. After being driven down an astounding amount in early April, offering more compelling proof of pure money-driven panicky liquidations, Dr. Copper has made its way back toward the top.
It’s not for any fundamental reasons. China remains on its downturn and, if anything, it has confirmed building is not going to be a huge part of the economic future even if Beijing manages to somehow work a macro miracle. Outside of the Chinese economy, there is no source of sustained opportunity let alone strength.


Instead, the constant threat of tariffs being applied to the metal (the Trump administration keeps saying a copper duty is being studied) has scrambled global supplies and kept metal on the move. In other words, more non-economic bids and copper pricing now in the low $5s.
Despite that and what may, to some, look like gold struggling, the copper-to-gold ratio has behaved a lot more like swaps have than not. With the tariff bid, CtG has managed to rise back above 0.0095% for the first time since, well, early April. Yet, at that level it would have been right near the lowest points in late 2024, meaning there really isn’t much to the bounce here.
And when comparing the current one to the previous supply shock jumps in early 2024 and then the one earlier this year which kicked off the tariff stampede, this one barely rates. So, when gold is basically doing nothing and copper is historically high for zero reasons that have to do with economy, the CtG ratio is way closer to a multi-decade low than even something like the low levels which first showed up late 2023 and early 2024, when those ratios were, like swaps, a loud and noticeable warning back then.
Take away the tariff mess from copper, where does CtG end up? More negative than even swaps.

It is difficult, not impossible, to parse bill changes especially when there is a debt ceiling effect on them already evident in their actions. Still, short, sharp moves back and forth like we’re getting isn’t that. While I don’t see anything suggesting something happening right now, there are a couple of indications here at the very end of 2025’s first half which demand attention and right from get-go of the second half.
The biggest and most immediate is how dealers are stocking up on bills themselves. That can – not always – precede an outbreak of deflationary collateral and money.
Then there are the background signals like swaps and CtG. As deeply negative like this, both have in mind a high probability of more April-like potential as much as the increasingly ugly macro picture confirmed by the BEA’s underappreciated (in the mainstream and across Wall Street, anyway) confirmation for the very recession-like downturn in spending and income data.
While the second quarter doesn’t end in the same way the first had, it is also nowhere near enough different.